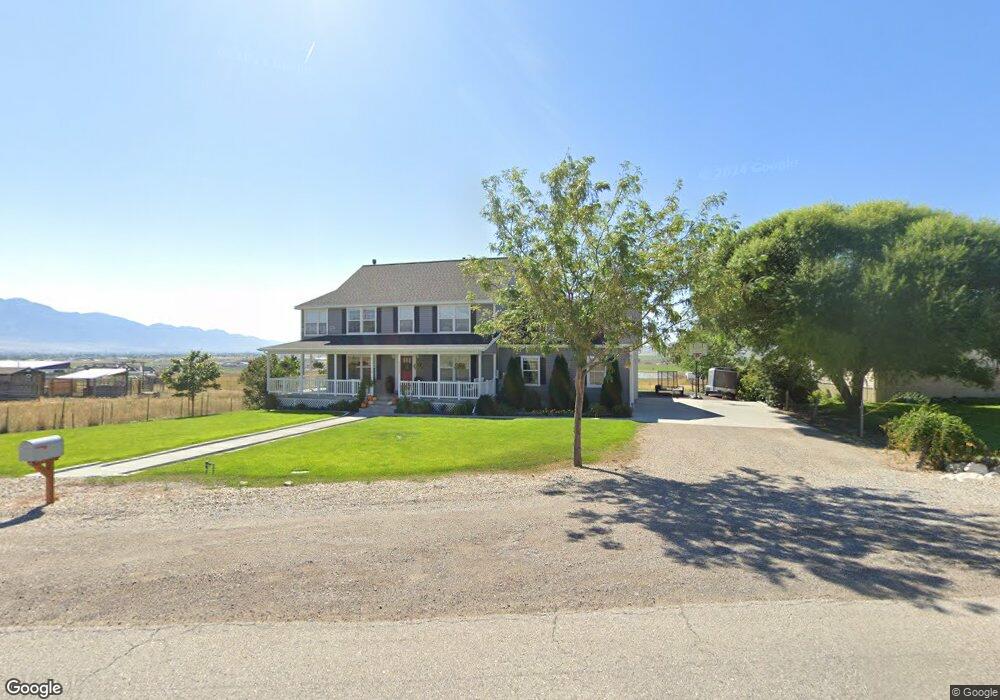
3355 W 1000 N Tremonton, UT 84337
Estimated Value: $589,000 - $715,000
5
Beds
4
Baths
4,253
Sq Ft
$149/Sq Ft
Est. Value
About This Home
This home is located at 3355 W 1000 N, Tremonton, UT 84337 and is currently estimated at $634,377, approximately $149 per square foot. 3355 W 1000 N is a home located in Box Elder County with nearby schools including Garland School, Alice C. Harris Intermediate School, and Bear River Middle School.
Ownership History
Date
Name
Owned For
Owner Type
Purchase Details
Closed on
Apr 27, 2013
Sold by
Fjedos Bryan and Fjedos Gretchen
Bought by
Miller James C
Current Estimated Value
Home Financials for this Owner
Home Financials are based on the most recent Mortgage that was taken out on this home.
Original Mortgage
$189,500
Interest Rate
4.46%
Mortgage Type
New Conventional
Purchase Details
Closed on
Jun 25, 2009
Sold by
Wilson D Mark and Wilson Judy A
Bought by
Fieldos Bryan and Fieldos Gretchen
Create a Home Valuation Report for This Property
The Home Valuation Report is an in-depth analysis detailing your home's value as well as a comparison with similar homes in the area
Home Values in the Area
Average Home Value in this Area
Purchase History
| Date | Buyer | Sale Price | Title Company |
|---|---|---|---|
| Miller James C | -- | Metro National Title | |
| Fieldos Bryan | -- | -- |
Source: Public Records
Mortgage History
| Date | Status | Borrower | Loan Amount |
|---|---|---|---|
| Previous Owner | Miller James C | $189,500 |
Source: Public Records
Tax History Compared to Growth
Tax History
| Year | Tax Paid | Tax Assessment Tax Assessment Total Assessment is a certain percentage of the fair market value that is determined by local assessors to be the total taxable value of land and additions on the property. | Land | Improvement |
|---|---|---|---|---|
| 2025 | $3,570 | $555,456 | $135,000 | $420,456 |
| 2024 | $3,294 | $570,370 | $140,000 | $430,370 |
| 2023 | $3,586 | $609,566 | $145,000 | $464,566 |
| 2022 | $2,931 | $284,298 | $19,250 | $265,048 |
| 2021 | $2,679 | $343,853 | $35,000 | $308,853 |
| 2020 | $2,232 | $343,853 | $35,000 | $308,853 |
| 2019 | $2,064 | $169,577 | $19,250 | $150,327 |
| 2018 | $2,032 | $152,440 | $16,500 | $135,940 |
| 2017 | $2,098 | $277,163 | $16,500 | $247,163 |
| 2016 | $2,058 | $145,967 | $16,500 | $129,467 |
| 2015 | $1,852 | $134,197 | $16,500 | $117,697 |
| 2014 | $1,852 | $128,592 | $16,500 | $112,092 |
| 2013 | -- | $128,592 | $16,005 | $112,587 |
Source: Public Records
Map
Nearby Homes
- 3566 W 1000 N
- 3101 W 1000 N
- 1069 N 2800 W
- 1081 N 2800 W
- 2618 W Mountain Rd
- 1175 N 2650 W
- 2411 W 1150 N Unit 11
- 2368 W 1150 N Unit 3
- 2442 W 1150 N Unit 1
- 2342 W 1150 N Unit 4
- 2436 W 1150 N Unit 12
- 2389 W 1150 N Unit 10
- 2371 W 1150 N Unit 9
- 2406 W 1150 N Unit 2
- 2353 W 1150 N Unit 8
- 2312 W 1150 N Unit 5
- 810 N 2300 W
- 2556 W 600 N
- Xavier Plan at Spring Hollow
- Vanbrough Plan at Spring Hollow