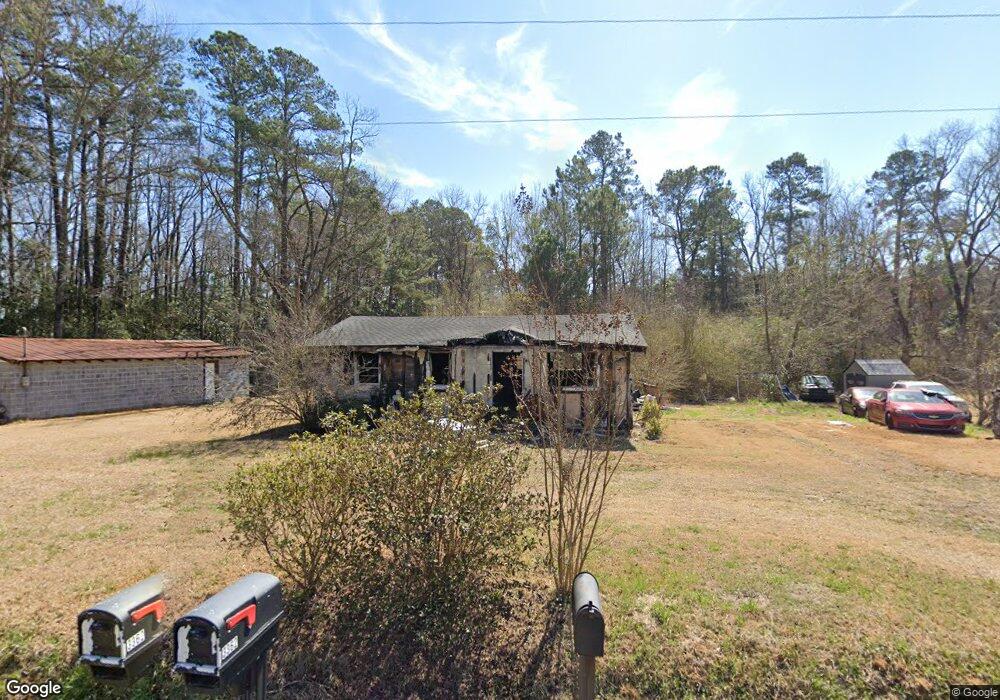
3359 Brinson Rd Currie, NC 28435
Estimated Value: $134,093 - $291,000
2
Beds
1
Bath
875
Sq Ft
$245/Sq Ft
Est. Value
About This Home
This home is located at 3359 Brinson Rd, Currie, NC 28435 and is currently estimated at $214,023, approximately $244 per square foot. 3359 Brinson Rd is a home located in Pender County with nearby schools including Malpass Corner Elementary School, West Pender Middle School, and Pender High School.
Ownership History
Date
Name
Owned For
Owner Type
Purchase Details
Closed on
May 25, 2004
Bought by
Lewis Pamela
Current Estimated Value
Create a Home Valuation Report for This Property
The Home Valuation Report is an in-depth analysis detailing your home's value as well as a comparison with similar homes in the area
Home Values in the Area
Average Home Value in this Area
Purchase History
| Date | Buyer | Sale Price | Title Company |
|---|---|---|---|
| Lewis Pamela | -- | -- |
Source: Public Records
Tax History Compared to Growth
Tax History
| Year | Tax Paid | Tax Assessment Tax Assessment Total Assessment is a certain percentage of the fair market value that is determined by local assessors to be the total taxable value of land and additions on the property. | Land | Improvement |
|---|---|---|---|---|
| 2024 | $290 | $74,888 | $27,500 | $47,388 |
| 2023 | $874 | $74,888 | $27,500 | $47,388 |
| 2022 | $825 | $74,888 | $27,500 | $47,388 |
| 2021 | $825 | $74,888 | $27,500 | $47,388 |
| 2020 | $825 | $74,888 | $27,500 | $47,388 |
| 2019 | $825 | $74,888 | $27,500 | $47,388 |
| 2018 | $543 | $38,119 | $10,000 | $28,119 |
| 2017 | $543 | $38,119 | $10,000 | $28,119 |
| 2016 | $539 | $38,119 | $10,000 | $28,119 |
| 2015 | $504 | $38,119 | $10,000 | $28,119 |
| 2014 | $422 | $38,119 | $10,000 | $28,119 |
| 2013 | -- | $38,119 | $10,000 | $28,119 |
| 2012 | -- | $38,119 | $10,000 | $28,119 |
Source: Public Records
Map
Nearby Homes
- 8033 Malpass Corner Rd
- 6079 Bell Williams Rd
- 63 George Washington Hales Dr
- 506 Tory Trail
- 282 James E Moore Rd
- 325 Messer Loop Rd
- 217 Trotters Ln
- 2092 John Henry Store Rd
- 210 Hwy
- 3763 Bell Williams Rd
- 3848 Rooks Rd
- 168 Montague Rd
- 130 Vineyard Trace
- 250 Long Bluff
- 225 Bridal Creek Dr
- 291 Creekstone Trail
- 23338 Nc Highway 210
- 11 Peach Bluff
- 108 Plum Ct
- 111 Plum Ct
- 3379 Brinson Rd
- 3362 Brinson Rd
- 3399 Brinson Rd
- 3344 Brinson Rd
- 3428 Brinson Rd
- 3273 Brinson Rd
- 3443 Brinson Rd
- 3466 Brinson Rd
- 744 Borough Rd
- 28305 Nc Hwy 210
- 3530 Brinson Rd
- 796 Borough Rd
- 28215 Nc Hwy 210
- 28395 N Carolina 210
- 28395 Highway 210
- 3606 Brinson Rd
- 421 Borough Rd
- 2990 Brinson Rd
- 3626 Brinson Rd
- 28443 Nc Highway 210