3359 Eagles Loft Unit A Cortland, OH 44410
Estimated Value: $152,678 - $167,000
2
Beds
2
Baths
1,464
Sq Ft
$111/Sq Ft
Est. Value
About This Home
This home is located at 3359 Eagles Loft Unit A, Cortland, OH 44410 and is currently estimated at $162,170, approximately $110 per square foot. 3359 Eagles Loft Unit A is a home located in Trumbull County with nearby schools including Lakeview Elementary School, Lakeview Middle School, and Lakeview High School.
Ownership History
Date
Name
Owned For
Owner Type
Purchase Details
Closed on
Dec 14, 2010
Sold by
Cornicello Anthony and Cornicello Leslie
Bought by
Mancini Anthony M
Current Estimated Value
Home Financials for this Owner
Home Financials are based on the most recent Mortgage that was taken out on this home.
Original Mortgage
$50,000
Outstanding Balance
$33,034
Interest Rate
4.22%
Mortgage Type
New Conventional
Estimated Equity
$129,136
Purchase Details
Closed on
Aug 10, 2010
Sold by
Wells Fargo Bank Na
Bought by
Cornicello Anthony
Purchase Details
Closed on
May 12, 2010
Sold by
Velly Paul M and Velly Georgia L
Bought by
Wells Fargo Bank National Association
Purchase Details
Closed on
May 23, 1996
Sold by
Woodland Trails Inc
Bought by
Velly Paul M and Velly Georgia L
Home Financials for this Owner
Home Financials are based on the most recent Mortgage that was taken out on this home.
Original Mortgage
$83,487
Interest Rate
8.1%
Mortgage Type
VA
Create a Home Valuation Report for This Property
The Home Valuation Report is an in-depth analysis detailing your home's value as well as a comparison with similar homes in the area
Home Values in the Area
Average Home Value in this Area
Purchase History
| Date | Buyer | Sale Price | Title Company |
|---|---|---|---|
| Mancini Anthony M | $80,000 | Attorney | |
| Cornicello Anthony | $50,000 | Nova Title Agency Inc | |
| Wells Fargo Bank National Association | $50,000 | Attorney | |
| Velly Paul M | $81,850 | -- |
Source: Public Records
Mortgage History
| Date | Status | Borrower | Loan Amount |
|---|---|---|---|
| Open | Mancini Anthony M | $50,000 | |
| Previous Owner | Velly Paul M | $83,487 |
Source: Public Records
Tax History
| Year | Tax Paid | Tax Assessment Tax Assessment Total Assessment is a certain percentage of the fair market value that is determined by local assessors to be the total taxable value of land and additions on the property. | Land | Improvement |
|---|---|---|---|---|
| 2024 | $2,247 | $44,490 | $3,680 | $40,810 |
| 2023 | $2,244 | $44,490 | $3,680 | $40,810 |
| 2022 | $1,211 | $30,280 | $3,330 | $26,950 |
| 2021 | $1,215 | $30,280 | $3,330 | $26,950 |
| 2020 | $1,222 | $30,280 | $3,330 | $26,950 |
| 2019 | $1,125 | $27,830 | $3,330 | $24,500 |
| 2018 | $1,130 | $27,830 | $3,330 | $24,500 |
| 2017 | $1,127 | $27,830 | $3,330 | $24,500 |
| 2016 | $1,026 | $25,550 | $3,010 | $22,540 |
| 2015 | $1,029 | $25,550 | $3,010 | $22,540 |
| 2014 | $945 | $25,550 | $3,010 | $22,540 |
| 2013 | $1,124 | $28,360 | $3,330 | $25,030 |
Source: Public Records
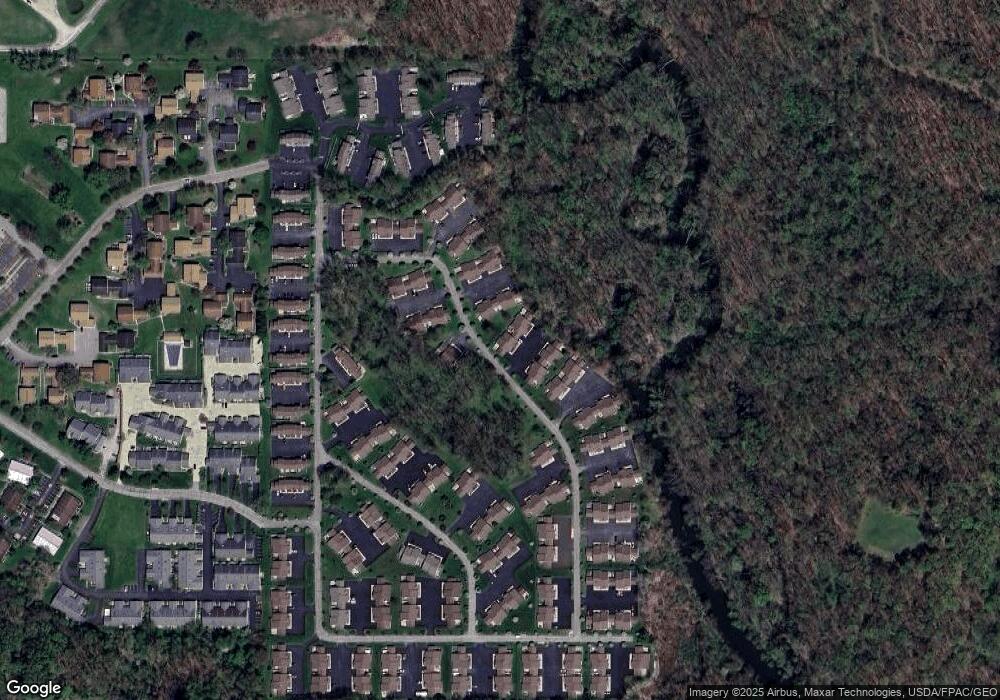
Map
Nearby Homes
- 3204 Deer Trail Unit D
- 3275 Woodland Trail Unit D
- 3406 Ivy Hill Cir Unit B
- 3159 Ivy Hill Cir Unit B
- 3477 Ivy Hill Cir Unit B
- 3023 Ivy Hill Cir Unit D
- 2310 Wilshire Dr
- 0 Cheeks Ct
- 2796 Timberline Dr
- 2869 Pebble Creek Ct
- 2698 McCleary Jacoby Rd
- 3024 Fallehn Dr
- 2342 McCleary Jacoby Rd
- 92 Larry Ln
- 2261 Saddlebrook Ln
- 0 Niles Ashtabula Rd Unit 5147189
- 2432 Cadwallader Sonk Rd
- 404 River Glen Dr NE Unit 402
- 0 Durst Dr
- 4167 N River Rd NE
- 3359 Eagles Loft Unit D
- 3359 Eagles Loft Unit C
- 3359 Eagles Loft Unit B
- 3369 Eagles Loft Unit 3369D
- 3369 Eagles Loft
- 3369 Eagles Loft Unit 3369B
- 3369 Eagles Loft
- 3369 Eagles Loft Unit D
- 3369 Eagles Loft Unit B
- 3369 Eagles Loft
- 328 Eagles Loft
- 3349 Eagles Loft Unit D
- 3349 Eagles Loft Unit B
- 3349 Eagles Loft Unit A
- 3349 Eagles Loft
- 3379 Eagles Loft
- 3379 Eagles Loft Unit 24C
- 3379 Eagles Loft Unit 24B
- 3379 Eagles Loft
- 3379 Eagles Loft Unit C
Your Personal Tour Guide
Ask me questions while you tour the home.