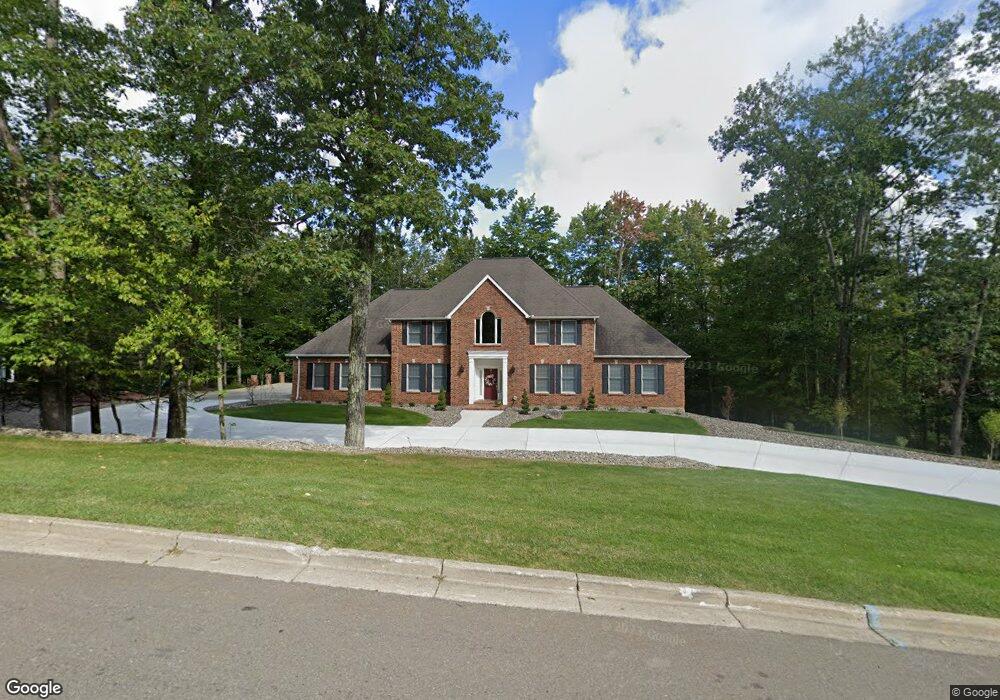
3359 Laurie Brook Dr Binghamton, NY 13903
Estimated Value: $349,000 - $773,420
4
Beds
4
Baths
3,473
Sq Ft
$172/Sq Ft
Est. Value
About This Home
This home is located at 3359 Laurie Brook Dr, Binghamton, NY 13903 and is currently estimated at $597,807, approximately $172 per square foot. 3359 Laurie Brook Dr is a home located in Broome County with nearby schools including Susquehanna Valley High School, Hillel Academy of Broome County, and St. John the Evangelist School.
Ownership History
Date
Name
Owned For
Owner Type
Purchase Details
Closed on
Dec 17, 2011
Sold by
Gist Christopher W R and Wicker Gist Nechelle M
Bought by
Devincentis Joseph S and Devincentis Lisa
Current Estimated Value
Home Financials for this Owner
Home Financials are based on the most recent Mortgage that was taken out on this home.
Original Mortgage
$350,000
Outstanding Balance
$140,379
Interest Rate
3.98%
Mortgage Type
New Conventional
Estimated Equity
$457,428
Purchase Details
Closed on
Dec 4, 2006
Sold by
Gist Christopher
Bought by
Gist Christopher
Purchase Details
Closed on
Nov 16, 2006
Sold by
Ryder Maureen
Bought by
Gist Christopher
Purchase Details
Closed on
Oct 30, 2003
Sold by
Cendant Mobility Financial Crp
Bought by
Ryder Maureen
Create a Home Valuation Report for This Property
The Home Valuation Report is an in-depth analysis detailing your home's value as well as a comparison with similar homes in the area
Home Values in the Area
Average Home Value in this Area
Purchase History
| Date | Buyer | Sale Price | Title Company |
|---|---|---|---|
| Devincentis Joseph S | $620,000 | None Available | |
| Gist Christopher | -- | Jon Sarra | |
| Gist Christopher | $685,000 | Jon Sarra | |
| Ryder Maureen | $620,000 | -- | |
| Cendant Mobility Financial Crp | $620,000 | -- |
Source: Public Records
Mortgage History
| Date | Status | Borrower | Loan Amount |
|---|---|---|---|
| Open | Devincentis Joseph S | $350,000 |
Source: Public Records
Tax History Compared to Growth
Tax History
| Year | Tax Paid | Tax Assessment Tax Assessment Total Assessment is a certain percentage of the fair market value that is determined by local assessors to be the total taxable value of land and additions on the property. | Land | Improvement |
|---|---|---|---|---|
| 2024 | $9,521 | $420,000 | $50,000 | $370,000 |
| 2023 | $9,179 | $420,000 | $50,000 | $370,000 |
| 2022 | $8,544 | $420,000 | $50,000 | $370,000 |
| 2021 | $9,382 | $420,000 | $50,000 | $370,000 |
| 2020 | $8,961 | $420,000 | $50,000 | $370,000 |
| 2019 | -- | $420,000 | $50,000 | $370,000 |
| 2018 | $9,793 | $420,000 | $50,000 | $370,000 |
| 2017 | $9,925 | $420,000 | $50,000 | $370,000 |
| 2016 | $10,525 | $420,000 | $50,000 | $370,000 |
| 2015 | -- | $420,000 | $50,000 | $370,000 |
| 2014 | -- | $420,000 | $50,000 | $370,000 |
Source: Public Records
Map
Nearby Homes
- 2101 W Hamton Rd
- 500 Gillen Dr
- 12 Stanford Rd
- 88 Aldrich Ave
- 31 Denton Rd
- 1008 Vestal Ave
- 4805 Marshall Dr E
- 40 Blackstone Ave
- 1 Fuller Hollow Rd
- 40 Larchmont Rd
- 25 Hotchkiss St
- 2030 Rexford St
- 22 Larchmont Rd
- 100 Elsmere Place
- 6 Brookfield Rd
- 1953 Franklin St
- 129 Pennsylvania Ave
- 112 Park Ave
- 61 Audubon Ave
- 1316 Campus Dr
- 3357 Laurie Brook Dr
- 3348 Cynthia Dr
- 3363 Laurie Brook Dr
- 3366 Laurie Brook Dr
- 3355 Laurie Brook Dr
- 3360 Cynthia Dr
- 3358 Laurie Brook Dr
- 3353 Laurie Brook Dr
- 3376 Laurie Brook Dr
- 3340 Cynthia Dr
- 3366 Douglas Dr
- 3368 Laurie Brook Dr
- 3367 Douglas Dr
- 3336 Cynthia Dr
- 3365 Laurie Brook Dr
- 3341 Cynthia Dr
- 3370 Laurie Brook Dr
- 3365 Cynthia Dr
- 28 Thistlewood Dr
- 3332 Cynthia Dr