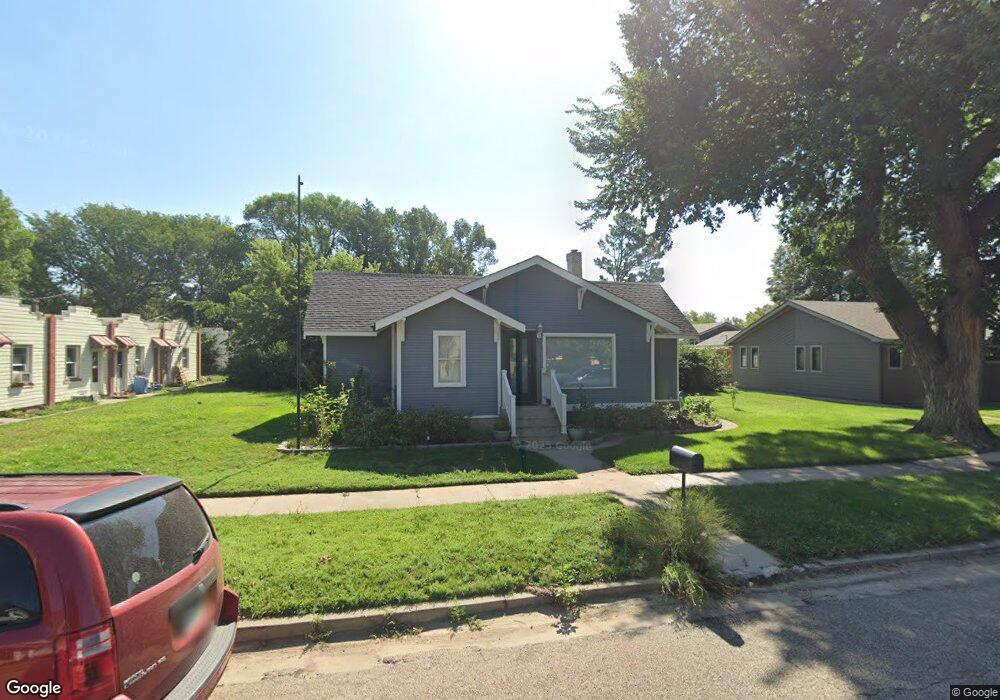
336 13th St Burlington, CO 80807
Estimated Value: $272,971 - $295,000
4
Beds
2
Baths
2,677
Sq Ft
$106/Sq Ft
Est. Value
About This Home
This home is located at 336 13th St, Burlington, CO 80807 and is currently estimated at $284,493, approximately $106 per square foot. 336 13th St is a home located in Kit Carson County with nearby schools including Burlington Elementary School, Burlington Middle School, and Burlington High School.
Ownership History
Date
Name
Owned For
Owner Type
Purchase Details
Closed on
Aug 28, 2020
Sold by
Blanford Barbara S
Bought by
Harrel Casey Blaine and Harrel Megan Renee
Current Estimated Value
Home Financials for this Owner
Home Financials are based on the most recent Mortgage that was taken out on this home.
Original Mortgage
$225,834
Outstanding Balance
$200,413
Interest Rate
2.9%
Mortgage Type
FHA
Estimated Equity
$84,080
Purchase Details
Closed on
Jul 13, 2020
Sold by
Stelt Melissa B Vander and Blandford Maggie A
Bought by
Blandford Barbara S
Home Financials for this Owner
Home Financials are based on the most recent Mortgage that was taken out on this home.
Original Mortgage
$225,834
Outstanding Balance
$200,413
Interest Rate
2.9%
Mortgage Type
FHA
Estimated Equity
$84,080
Purchase Details
Closed on
Mar 17, 2016
Sold by
Blandford Barbara S
Bought by
Blandford Barbara S and Blandford Melissa B
Create a Home Valuation Report for This Property
The Home Valuation Report is an in-depth analysis detailing your home's value as well as a comparison with similar homes in the area
Home Values in the Area
Average Home Value in this Area
Purchase History
| Date | Buyer | Sale Price | Title Company |
|---|---|---|---|
| Harrel Casey Blaine | $230,000 | First American Mortgage Sln | |
| Blandford Barbara S | -- | None Available | |
| Blandford Barbara S | -- | None Available | |
| Blandford Barbara S | $195,000 | None Available |
Source: Public Records
Mortgage History
| Date | Status | Borrower | Loan Amount |
|---|---|---|---|
| Open | Harrel Casey Blaine | $225,834 |
Source: Public Records
Tax History Compared to Growth
Tax History
| Year | Tax Paid | Tax Assessment Tax Assessment Total Assessment is a certain percentage of the fair market value that is determined by local assessors to be the total taxable value of land and additions on the property. | Land | Improvement |
|---|---|---|---|---|
| 2024 | $1,426 | $15,389 | $757 | $14,632 |
| 2023 | $1,426 | $15,389 | $757 | $14,632 |
| 2022 | $1,284 | $15,636 | $699 | $14,937 |
| 2021 | $1,305 | $16,086 | $720 | $15,366 |
| 2020 | $906 | $11,306 | $626 | $10,680 |
| 2019 | $905 | $11,306 | $626 | $10,680 |
| 2018 | $838 | $10,454 | $630 | $9,824 |
| 2017 | $836 | $10,287 | $0 | $0 |
| 2016 | $824 | $10,287 | $0 | $0 |
| 2015 | $819 | $0 | $0 | $0 |
| 2014 | $872 | $0 | $0 | $0 |
Source: Public Records
Map
Nearby Homes