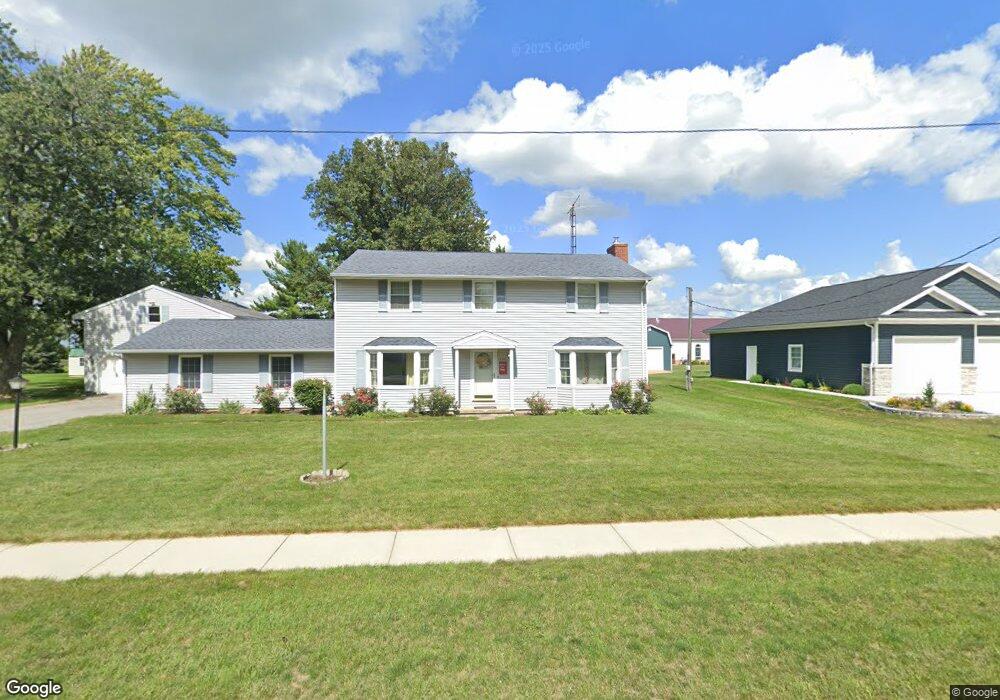
336 E Oliver St Mc Comb, OH 45858
McComb NeighborhoodEstimated Value: $179,000 - $226,000
4
Beds
3
Baths
2,856
Sq Ft
$74/Sq Ft
Est. Value
About This Home
This home is located at 336 E Oliver St, Mc Comb, OH 45858 and is currently estimated at $212,149, approximately $74 per square foot. 336 E Oliver St is a home with nearby schools including McComb Elementary School, McComb Middle School, and Mccomb Local High School.
Ownership History
Date
Name
Owned For
Owner Type
Purchase Details
Closed on
Aug 20, 2012
Sold by
Shoop Nicholas W and Shoop Danielle C
Bought by
Kryling John G and Kryling Robin L
Current Estimated Value
Purchase Details
Closed on
Sep 1, 2010
Sold by
Kryling Robyn L and Kryling John G
Bought by
Shoop Nicholas W and Shoop Danielle C
Home Financials for this Owner
Home Financials are based on the most recent Mortgage that was taken out on this home.
Original Mortgage
$160,000
Interest Rate
4.3%
Mortgage Type
Seller Take Back
Purchase Details
Closed on
Jan 19, 2007
Sold by
Shoop William R
Bought by
Shoop Robin L
Home Financials for this Owner
Home Financials are based on the most recent Mortgage that was taken out on this home.
Original Mortgage
$96,000
Interest Rate
6.4%
Mortgage Type
New Conventional
Create a Home Valuation Report for This Property
The Home Valuation Report is an in-depth analysis detailing your home's value as well as a comparison with similar homes in the area
Home Values in the Area
Average Home Value in this Area
Purchase History
| Date | Buyer | Sale Price | Title Company |
|---|---|---|---|
| Kryling John G | -- | Attorney | |
| Shoop Nicholas W | $160,000 | Attorney | |
| Shoop Robin L | -- | Attorney |
Source: Public Records
Mortgage History
| Date | Status | Borrower | Loan Amount |
|---|---|---|---|
| Previous Owner | Shoop Nicholas W | $160,000 | |
| Previous Owner | Shoop Robin L | $96,000 |
Source: Public Records
Tax History
| Year | Tax Paid | Tax Assessment Tax Assessment Total Assessment is a certain percentage of the fair market value that is determined by local assessors to be the total taxable value of land and additions on the property. | Land | Improvement |
|---|---|---|---|---|
| 2024 | $2,314 | $66,550 | $6,550 | $60,000 |
| 2023 | $2,300 | $66,550 | $6,550 | $60,000 |
| 2022 | $2,721 | $66,550 | $6,550 | $60,000 |
| 2021 | $2,444 | $53,900 | $5,940 | $47,960 |
| 2020 | $2,143 | $53,900 | $5,940 | $47,960 |
| 2019 | $2,342 | $53,900 | $5,940 | $47,960 |
| 2018 | $1,966 | $47,330 | $5,170 | $42,160 |
| 2017 | $989 | $47,330 | $5,170 | $42,160 |
| 2016 | $2,300 | $47,330 | $5,170 | $42,160 |
| 2015 | $2,303 | $46,750 | $5,510 | $41,240 |
| 2014 | $2,321 | $46,750 | $5,510 | $41,240 |
| 2012 | $2,335 | $55,210 | $5,510 | $49,700 |
Source: Public Records
Map
Nearby Homes
- 257 S Main St
- 131 E South St
- 223 Cherry St
- 0 Joshua Rd Unit 6126475
- 3470 Ohio 235
- 4609 Township Road 235
- 4134 County Road 203
- 3111 Township Road 93
- 4014 County Road 139
- 358 State Route 613
- 1128 County Road 139
- 7780 Township Road 89
- 0 Rock Candy Rd Unit Lot 159
- 0 Rock Candy Rd Unit Lot 170
- 0 Rock Candy Rd Unit Lot 172 206819
- 0 Rock Candy Rd Unit Lot 162
- 0 Rock Candy Rd Unit Lot 171
- 0 Rock Candy Rd Unit Lot 168
- 9894 Smokies Way
- 0 Rock Candy Rd Or Bushwillow Dr Unit Lot 173
- 324 E Oliver St
- 0 E Oliver St Unit H115165
- 0 E Oliver St Unit H135686
- 0 E Oliver St
- 342 E Oliver St
- 316 E Oliver St
- 335 E Oliver St
- 343 E Oliver St
- 354 E Oliver St
- 314 E Oliver St
- 319 E Oliver St
- 315 Ackerly St
- 224 E Perrin Ave
- 304 E Oliver St
- 240 E Perrin Ave
- 404 E Oliver St
- 223 Pearl St
- 228 E Perrin Ave
- 232 E Perrin Ave
- 248 E Perrin Ave
Your Personal Tour Guide
Ask me questions while you tour the home.