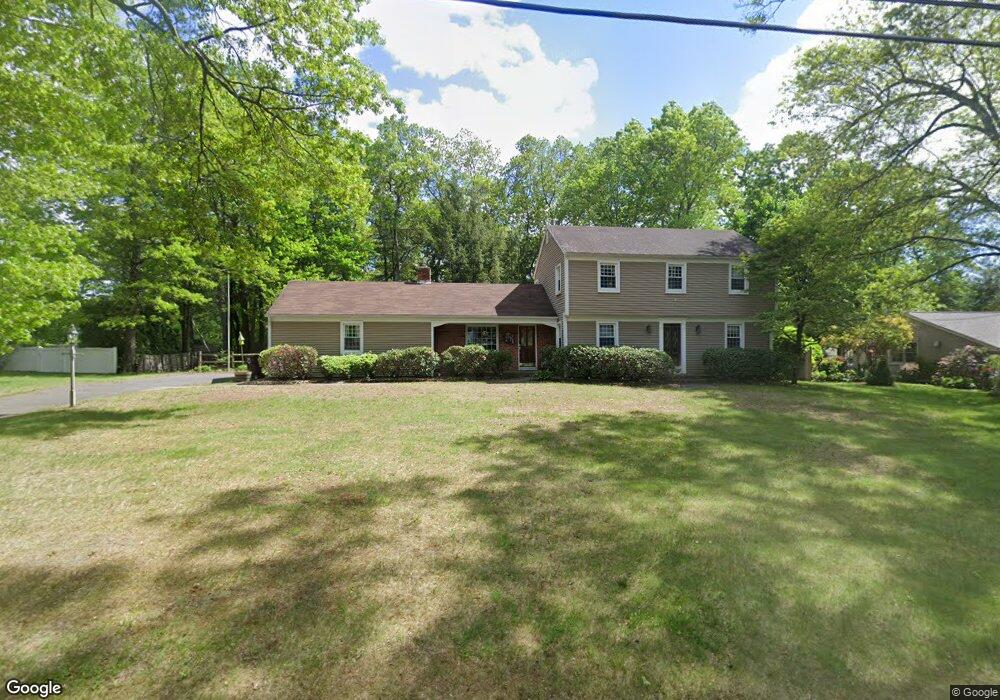
336 Falley Dr Westfield, MA 01085
Estimated Value: $444,000 - $634,000
3
Beds
4
Baths
1,868
Sq Ft
$268/Sq Ft
Est. Value
About This Home
This home is located at 336 Falley Dr, Westfield, MA 01085 and is currently estimated at $500,373, approximately $267 per square foot. 336 Falley Dr is a home located in Hampden County with nearby schools including Westfield High School and Saint Mary High School.
Ownership History
Date
Name
Owned For
Owner Type
Purchase Details
Closed on
Nov 26, 2002
Sold by
Morrison Andrew P and Morrison Sharyn L
Bought by
Howes Patrycia and Howes Paul
Current Estimated Value
Home Financials for this Owner
Home Financials are based on the most recent Mortgage that was taken out on this home.
Original Mortgage
$212,000
Interest Rate
6.07%
Mortgage Type
Purchase Money Mortgage
Purchase Details
Closed on
Jul 20, 2001
Sold by
Hatch Gerald F
Bought by
Morrison Andrew P and Morrison Sharyn L
Create a Home Valuation Report for This Property
The Home Valuation Report is an in-depth analysis detailing your home's value as well as a comparison with similar homes in the area
Home Values in the Area
Average Home Value in this Area
Purchase History
| Date | Buyer | Sale Price | Title Company |
|---|---|---|---|
| Howes Patrycia | $265,000 | -- | |
| Morrison Andrew P | $200,000 | -- |
Source: Public Records
Mortgage History
| Date | Status | Borrower | Loan Amount |
|---|---|---|---|
| Open | Morrison Andrew P | $222,400 | |
| Closed | Howes Patrycia | $212,000 | |
| Previous Owner | Morrison Andrew P | $49,900 |
Source: Public Records
Tax History Compared to Growth
Tax History
| Year | Tax Paid | Tax Assessment Tax Assessment Total Assessment is a certain percentage of the fair market value that is determined by local assessors to be the total taxable value of land and additions on the property. | Land | Improvement |
|---|---|---|---|---|
| 2025 | $6,196 | $408,200 | $140,000 | $268,200 |
| 2024 | $6,208 | $388,700 | $127,600 | $261,100 |
| 2023 | $5,963 | $351,200 | $121,700 | $229,500 |
| 2022 | $5,765 | $311,800 | $108,300 | $203,500 |
| 2021 | $5,588 | $296,000 | $102,000 | $194,000 |
| 2020 | $5,423 | $281,700 | $102,000 | $179,700 |
| 2019 | $0 | $269,700 | $97,100 | $172,600 |
| 2018 | $3,471 | $269,700 | $97,100 | $172,600 |
| 2017 | $5,131 | $264,200 | $98,700 | $165,500 |
| 2016 | $5,136 | $264,200 | $98,700 | $165,500 |
| 2015 | $4,722 | $254,700 | $98,700 | $156,000 |
| 2014 | $3,533 | $254,700 | $98,700 | $156,000 |
Source: Public Records
Map
Nearby Homes
- 20 Raymond Cir
- 451 Falley Dr
- 1037 Shaker Rd
- 57 Falley Dr
- 94 Pineridge Dr
- 16 Locust St
- 76 Shaker Rd
- 60 Shaker Rd
- 23 Tannery Rd Unit B
- 17 Jeanne Marie Dr
- 0 Feeding Hills Rd
- 103 Feeding Hills Rd
- 30 Cross St
- 42 Rosewood Ln
- 22 Rosewood Ln
- 70-74 S Maple St
- 74 S Maple St
- 70 S Maple St
- 20 Great Brook Dr
- 16 Yale St