Estimated Value: $77,000 - $96,000
2
Beds
1
Bath
676
Sq Ft
$128/Sq Ft
Est. Value
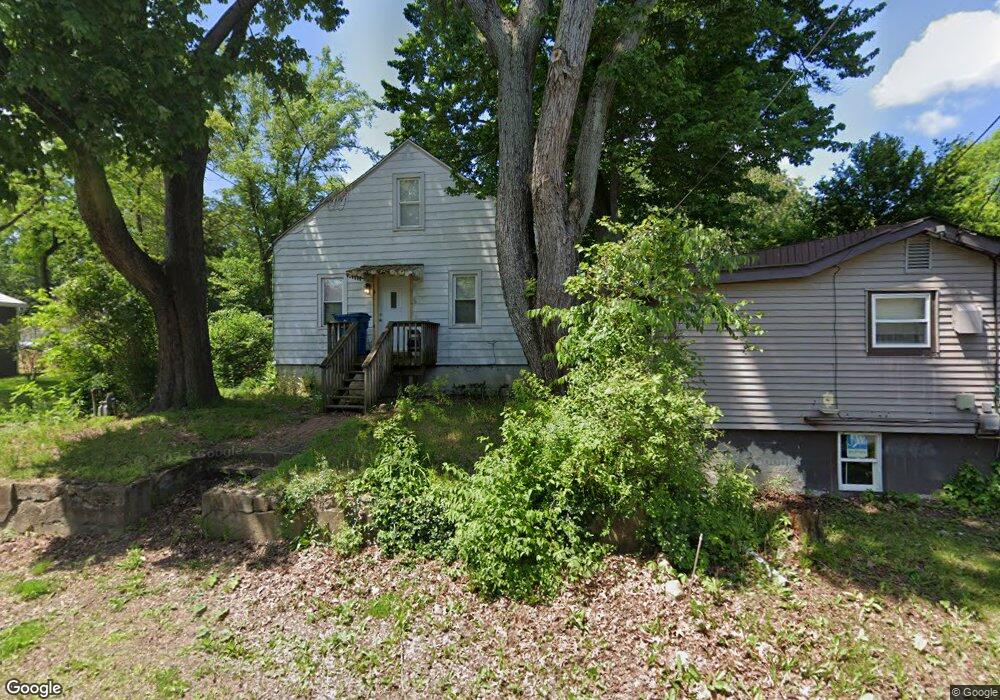
About This Home
This home is located at 336 Killian Rd, Akron, OH 44319 and is currently estimated at $86,403, approximately $127 per square foot. 336 Killian Rd is a home located in Summit County with nearby schools including Coventry Middle School, Coventry High School, and Chapel Hill Christian School-Green Campus.
Ownership History
Date
Name
Owned For
Owner Type
Purchase Details
Closed on
Feb 25, 2022
Sold by
Lane Darlene M
Bought by
Fu Yechun
Current Estimated Value
Purchase Details
Closed on
Feb 24, 2022
Sold by
Lane Darlene M
Bought by
Fu Yechun
Purchase Details
Closed on
Feb 23, 2022
Sold by
Lane Darlene M
Bought by
Fu Yechun
Purchase Details
Closed on
Jun 6, 1999
Sold by
Unkefer Wayne and Unkefer Wayne W
Bought by
Lane Darlene M
Home Financials for this Owner
Home Financials are based on the most recent Mortgage that was taken out on this home.
Original Mortgage
$56,493
Interest Rate
7.06%
Mortgage Type
FHA
Purchase Details
Closed on
Mar 15, 1996
Sold by
Chlebina John
Bought by
Unkefer Wayne
Home Financials for this Owner
Home Financials are based on the most recent Mortgage that was taken out on this home.
Original Mortgage
$36,750
Interest Rate
7.06%
Mortgage Type
New Conventional
Create a Home Valuation Report for This Property
The Home Valuation Report is an in-depth analysis detailing your home's value as well as a comparison with similar homes in the area
Home Values in the Area
Average Home Value in this Area
Purchase History
| Date | Buyer | Sale Price | Title Company |
|---|---|---|---|
| Fu Yechun | $26,336 | Sawan Edmund M | |
| Fu Yechun | $26,336 | None Listed On Document | |
| Fu Yechun | $26,336 | Sawan Edmund M | |
| Lane Darlene M | $57,000 | Real Estate Title | |
| Unkefer Wayne | $38,700 | -- |
Source: Public Records
Mortgage History
| Date | Status | Borrower | Loan Amount |
|---|---|---|---|
| Previous Owner | Lane Darlene M | $56,493 | |
| Previous Owner | Unkefer Wayne | $36,750 |
Source: Public Records
Tax History
| Year | Tax Paid | Tax Assessment Tax Assessment Total Assessment is a certain percentage of the fair market value that is determined by local assessors to be the total taxable value of land and additions on the property. | Land | Improvement |
|---|---|---|---|---|
| 2025 | $1,800 | $28,308 | $8,442 | $19,866 |
| 2024 | $1,667 | $28,308 | $8,442 | $19,866 |
| 2023 | $1,800 | $28,308 | $8,442 | $19,866 |
| 2022 | $1,362 | $19,076 | $5,667 | $13,409 |
| 2021 | $1,323 | $19,076 | $5,667 | $13,409 |
| 2020 | $1,285 | $19,080 | $5,670 | $13,410 |
| 2019 | $1,162 | $16,160 | $5,670 | $10,490 |
| 2018 | $1,151 | $16,160 | $5,670 | $10,490 |
| 2017 | $1,168 | $16,160 | $5,670 | $10,490 |
| 2016 | $1,202 | $16,160 | $5,670 | $10,490 |
| 2015 | $1,168 | $16,160 | $5,670 | $10,490 |
| 2014 | $1,221 | $16,160 | $5,670 | $10,490 |
| 2013 | $1,197 | $17,210 | $5,670 | $11,540 |
Source: Public Records
Map
Nearby Homes
- 3085 Daisy Ave
- 3239 Lakeway St
- 3025 Lamb Dr
- 368 Jarvis Rd
- 61 Leicester Dr
- 2813 N Bender Ave
- 72 Weil Ave
- 3113 Sparrows Crest
- 2679 N Bender Ave
- 173 Portage Lakes Dr
- 253 Aqua Blvd
- 3785 S Main St
- 155 Moore Rd
- 265 E Pace Ave
- 156 W Ingleside Dr
- 196 Olivet Ave
- 206 Olivet Ave
- 960 Impala Dr
- 619 Moore Rd
- 0 W Warner Rd
- 3090 Buttercup Ave
- 346 Killian Rd
- 3111 Colopy St
- 3095 Buttercup Ave
- 3095 Buttercup Ave
- 3121 Colopy St
- 3111 Buttercup Ave
- 3131 Colopy St
- 3110 Cosmos Ave
- 3110 Cosmos Ave
- 370 Killian Rd
- 2529 Cottage Grove - Lot
- 3130 Colopy St
- 3128 Buttercup Ave
- 3128 Buttercup Ave
- 3134 Colopy St
- VL Cosmos St
- 384 Killian Rd
- 3123 Buttercup Ave
- 3123 Buttercup Ave
Your Personal Tour Guide
Ask me questions while you tour the home.