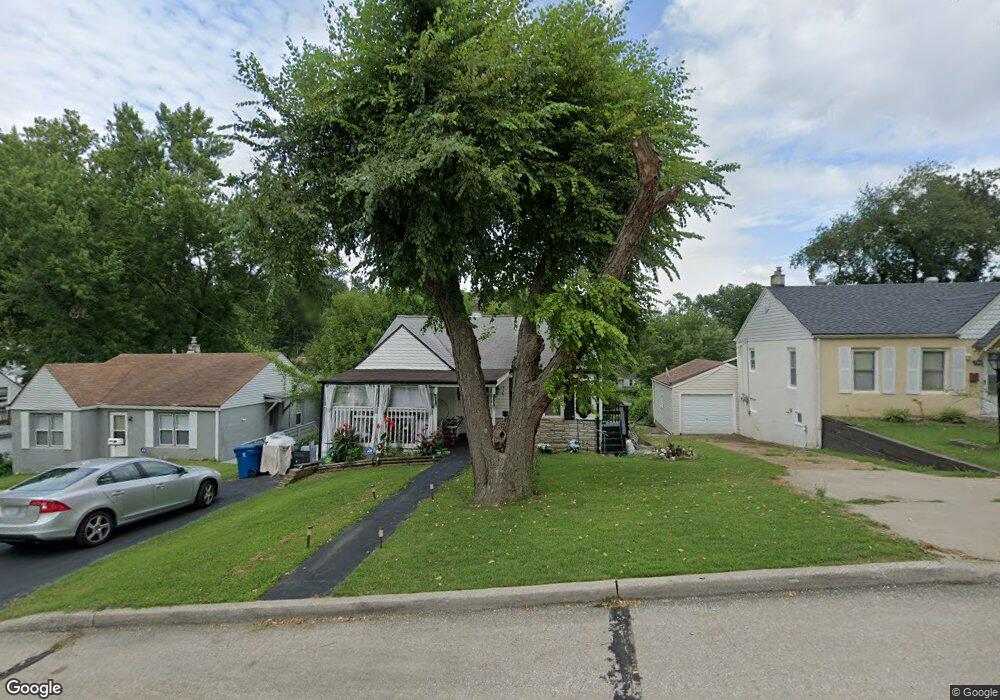
336 La Motte Ln Saint Louis, MO 63135
Estimated Value: $84,228 - $121,000
2
Beds
1
Bath
806
Sq Ft
$119/Sq Ft
Est. Value
About This Home
This home is located at 336 La Motte Ln, Saint Louis, MO 63135 and is currently estimated at $96,057, approximately $119 per square foot. 336 La Motte Ln is a home located in St. Louis County with nearby schools including Griffith Elementary School, Ferguson Middle School, and McCluer High School.
Ownership History
Date
Name
Owned For
Owner Type
Purchase Details
Closed on
Jan 27, 2021
Sold by
Mc2s Llc
Bought by
Mcclinton Avranette
Current Estimated Value
Purchase Details
Closed on
Dec 31, 2009
Sold by
Bram Realty Ii Llc
Bought by
Mc2s Llc
Home Financials for this Owner
Home Financials are based on the most recent Mortgage that was taken out on this home.
Original Mortgage
$187,175
Interest Rate
4.8%
Mortgage Type
Future Advance Clause Open End Mortgage
Purchase Details
Closed on
Jun 10, 2009
Sold by
St Christopher Llc
Bought by
Bram Realty Ii Llc
Purchase Details
Closed on
Jun 9, 2006
Sold by
Crews Corp
Bought by
St Christopher Llc
Home Financials for this Owner
Home Financials are based on the most recent Mortgage that was taken out on this home.
Original Mortgage
$64,000
Interest Rate
6.58%
Mortgage Type
Purchase Money Mortgage
Create a Home Valuation Report for This Property
The Home Valuation Report is an in-depth analysis detailing your home's value as well as a comparison with similar homes in the area
Home Values in the Area
Average Home Value in this Area
Purchase History
| Date | Buyer | Sale Price | Title Company |
|---|---|---|---|
| Mcclinton Avranette | -- | Title Partners Agency Llc | |
| Mcclinton Arvanette | $24,500 | Title Partners Agency Llc | |
| Mcclinton Avranette | -- | Title Partners | |
| Mc2s Llc | $37,435 | Ust | |
| Bram Realty Ii Llc | $69,085 | None Available | |
| St Christopher Llc | $46,150 | Ort | |
| Crews Corp | $39,150 | Ort |
Source: Public Records
Mortgage History
| Date | Status | Borrower | Loan Amount |
|---|---|---|---|
| Previous Owner | Mc2s Llc | $187,175 | |
| Previous Owner | St Christopher Llc | $64,000 |
Source: Public Records
Tax History Compared to Growth
Tax History
| Year | Tax Paid | Tax Assessment Tax Assessment Total Assessment is a certain percentage of the fair market value that is determined by local assessors to be the total taxable value of land and additions on the property. | Land | Improvement |
|---|---|---|---|---|
| 2025 | $913 | $16,330 | $2,380 | $13,950 |
| 2024 | $913 | $12,410 | $1,580 | $10,830 |
| 2023 | $913 | $12,410 | $1,580 | $10,830 |
| 2022 | $903 | $10,760 | $2,720 | $8,040 |
| 2021 | $874 | $10,760 | $2,720 | $8,040 |
| 2020 | $914 | $10,130 | $2,760 | $7,370 |
| 2019 | $897 | $10,130 | $2,760 | $7,370 |
| 2018 | $722 | $7,220 | $2,390 | $4,830 |
| 2017 | $708 | $7,220 | $2,390 | $4,830 |
| 2016 | $719 | $7,220 | $2,010 | $5,210 |
| 2015 | $724 | $7,220 | $2,010 | $5,210 |
| 2014 | $676 | $6,650 | $2,470 | $4,180 |
Source: Public Records
Map
Nearby Homes
- 506 Averill Ave
- 514 La Motte Ln
- 408 Coppinger Dr
- 315 Coppinger Dr
- 208 Coppinger Dr
- 818 Robert Ave
- 324 Ames Place
- 310 Ames Place
- 539 Coppinger Dr
- 610 Superior Dr
- 931 Thatcher Ave
- 410 Argent Ave
- 1209 Chambers Rd
- 339 Wedge Dr
- 418 Millman Dr
- 406 Teston Dr
- 57 Forestwood Dr
- 405 Teston Dr
- 509 Royal Ave
- 925 Dyerdown Ave
- 338 La Motte Ln
- 328 La Motte Ln
- 412 La Motte Ln
- 326 La Motte Ln
- 409 Averill Ave
- 320 La Motte Ln
- 416 La Motte Ln
- 321 Averill Ave
- 413 Averill Ave
- 409 La Motte Ln
- 316 La Motte Ln
- 417 Averill Ave
- 327 La Motte Ln
- 317 Averill Ave
- 420 La Motte Ln
- 415 La Motte Ln
- 320 Averill Ave
- 421 Averill Ave
- 319 La Motte Ln
- 315 Averill Ave