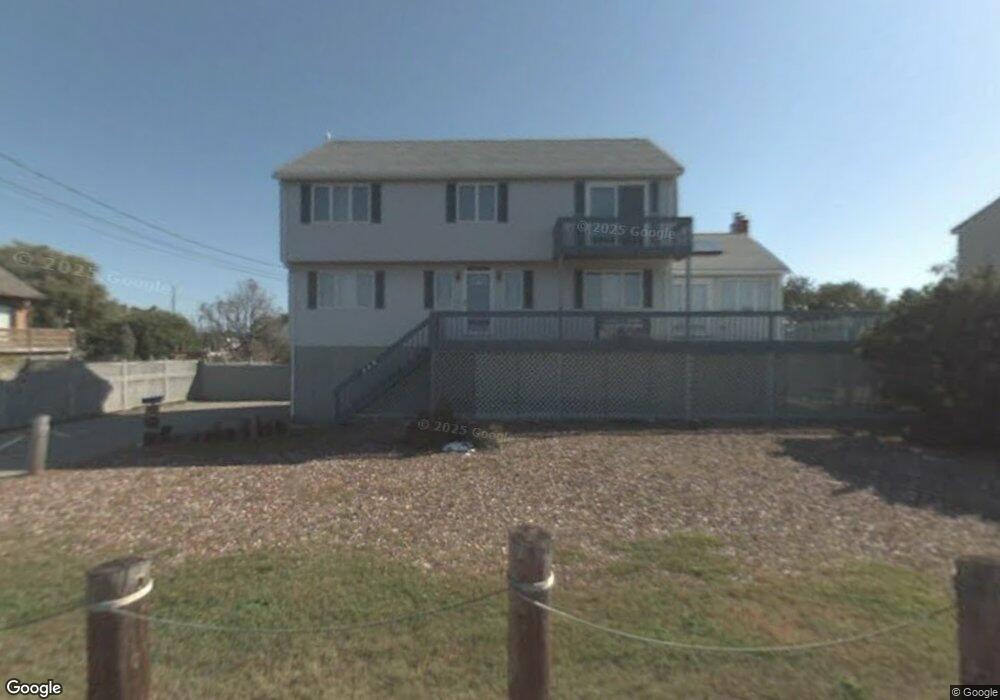
336 Newport Rd Hull, MA 02045
Strawberry Hill NeighborhoodEstimated Value: $866,226 - $1,242,000
3
Beds
3
Baths
2,252
Sq Ft
$442/Sq Ft
Est. Value
About This Home
This home is located at 336 Newport Rd, Hull, MA 02045 and is currently estimated at $995,307, approximately $441 per square foot. 336 Newport Rd is a home located in Plymouth County with nearby schools including Lillian M. Jacobs Elementary School, Memorial Middle School, and Hull High School.
Ownership History
Date
Name
Owned For
Owner Type
Purchase Details
Closed on
Apr 3, 2013
Sold by
Furlan Rt
Bought by
Salluce Jason
Current Estimated Value
Home Financials for this Owner
Home Financials are based on the most recent Mortgage that was taken out on this home.
Original Mortgage
$523,520
Outstanding Balance
$371,369
Interest Rate
3.58%
Mortgage Type
Purchase Money Mortgage
Estimated Equity
$623,938
Purchase Details
Closed on
Feb 23, 1995
Sold by
Stpierre Paul and Stpierre Carol
Bought by
Furlan John J and Furlan Patricia L
Home Financials for this Owner
Home Financials are based on the most recent Mortgage that was taken out on this home.
Original Mortgage
$150,000
Interest Rate
9.17%
Mortgage Type
Purchase Money Mortgage
Create a Home Valuation Report for This Property
The Home Valuation Report is an in-depth analysis detailing your home's value as well as a comparison with similar homes in the area
Home Values in the Area
Average Home Value in this Area
Purchase History
| Date | Buyer | Sale Price | Title Company |
|---|---|---|---|
| Salluce Jason | $515,000 | -- | |
| Salluce Jason | $515,000 | -- | |
| Furlan John J | $215,000 | -- |
Source: Public Records
Mortgage History
| Date | Status | Borrower | Loan Amount |
|---|---|---|---|
| Open | Salluce Jason | $523,520 | |
| Closed | Salluce Jason | $523,520 | |
| Previous Owner | Furlan John J | $150,000 |
Source: Public Records
Tax History
| Year | Tax Paid | Tax Assessment Tax Assessment Total Assessment is a certain percentage of the fair market value that is determined by local assessors to be the total taxable value of land and additions on the property. | Land | Improvement |
|---|---|---|---|---|
| 2025 | $8,116 | $724,600 | $319,200 | $405,400 |
| 2024 | $8,047 | $690,700 | $309,800 | $380,900 |
| 2023 | $8,105 | $666,000 | $309,800 | $356,200 |
| 2022 | $8,103 | $646,200 | $309,800 | $336,400 |
| 2021 | $7,788 | $614,200 | $281,700 | $332,500 |
| 2020 | $5,454 | $576,400 | $272,300 | $304,100 |
| 2019 | $7,278 | $557,700 | $262,900 | $294,800 |
| 2018 | $6,929 | $516,300 | $262,900 | $253,400 |
| 2017 | $6,827 | $497,600 | $262,900 | $234,700 |
| 2016 | $6,961 | $516,400 | $281,700 | $234,700 |
| 2015 | $6,602 | $473,600 | $234,700 | $238,900 |
| 2014 | $6,569 | $473,600 | $234,700 | $238,900 |
Source: Public Records
Map
Nearby Homes
- 332 Newport Rd
- 37 Dover St
- 350 Newport Rd
- 330 Newport Rd
- 1 Dover St
- 390 Newport Rd
- 12 Dover St
- 16 Dover St
- 31 Brookline Ave
- 375 Newport Rd
- 373 Newport Rd
- 373 Newport Rd
- 18 Brookline Ave
- 16 Brookline Ave
- 22 Brookline Ave
- 39 Brookline Ave
- 383 Newport Rd
- 28 Brookline Ave
- 404 Newport Rd
- 34 Brookline Ave Winter
Your Personal Tour Guide
Ask me questions while you tour the home.