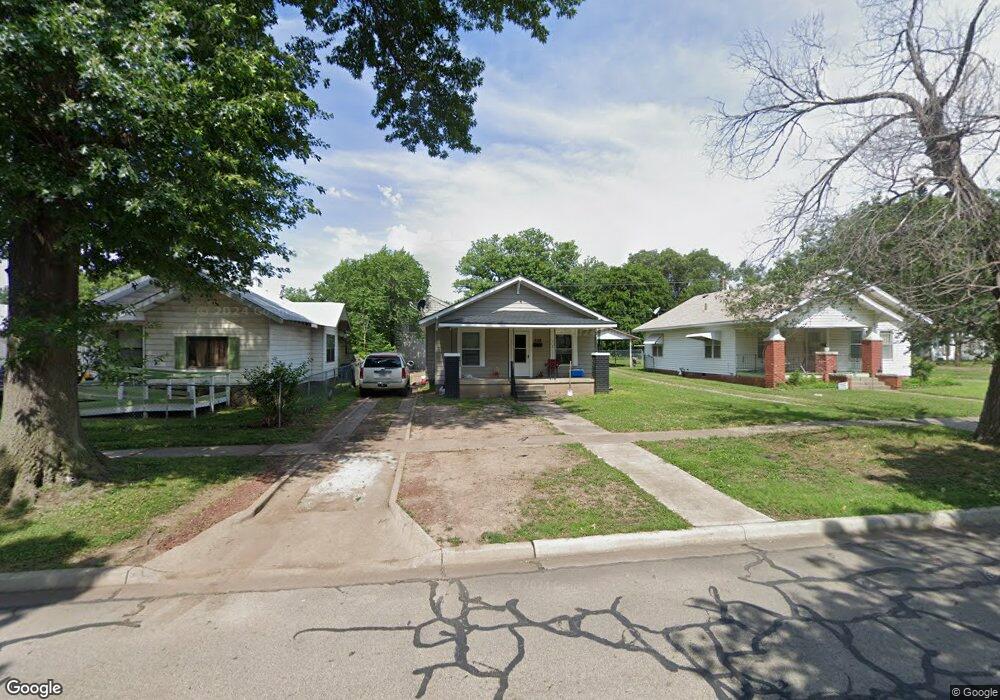
336 S Osage St Ponca City, OK 74601
Estimated Value: $40,000 - $52,000
2
Beds
1
Bath
1,039
Sq Ft
$45/Sq Ft
Est. Value
About This Home
This home is located at 336 S Osage St, Ponca City, OK 74601 and is currently estimated at $46,683, approximately $44 per square foot. 336 S Osage St is a home located in Kay County with nearby schools including Lincoln Elementary School, Ponca City West Middle School, and Ponca City East Middle School.
Ownership History
Date
Name
Owned For
Owner Type
Purchase Details
Closed on
Sep 13, 2022
Sold by
Epperly and Tara
Bought by
Hoffman Family Revocable Living Trust
Current Estimated Value
Purchase Details
Closed on
Mar 20, 2018
Sold by
Bennett Jameson Chad and Bennett Jamie Louise
Bought by
Affordable Improvements Llc
Purchase Details
Closed on
Dec 28, 2011
Sold by
Butler Claude D and Butler Wanda
Bought by
Bennett Jameson C
Purchase Details
Closed on
Apr 26, 1999
Sold by
Wanda Claude and Wanda Butler
Bought by
Wanda Claude and Wanda Rev Butler
Create a Home Valuation Report for This Property
The Home Valuation Report is an in-depth analysis detailing your home's value as well as a comparison with similar homes in the area
Home Values in the Area
Average Home Value in this Area
Purchase History
| Date | Buyer | Sale Price | Title Company |
|---|---|---|---|
| Hoffman Family Revocable Living Trust | $16,000 | -- | |
| Affordable Improvements Llc | -- | None Available | |
| Bennett Jameson C | $6,000 | -- | |
| Wanda Claude | -- | -- |
Source: Public Records
Tax History Compared to Growth
Tax History
| Year | Tax Paid | Tax Assessment Tax Assessment Total Assessment is a certain percentage of the fair market value that is determined by local assessors to be the total taxable value of land and additions on the property. | Land | Improvement |
|---|---|---|---|---|
| 2024 | $359 | $3,789 | $308 | $3,481 |
| 2023 | $359 | $3,662 | $308 | $3,354 |
| 2022 | $193 | $2,032 | $308 | $1,724 |
| 2021 | $194 | $2,032 | $308 | $1,724 |
| 2020 | $192 | $2,032 | $308 | $1,724 |
| 2019 | $187 | $1,954 | $308 | $1,646 |
| 2018 | $189 | $1,954 | $308 | $1,646 |
| 2017 | $190 | $1,940 | $308 | $1,632 |
| 2016 | $183 | $1,848 | $308 | $1,540 |
| 2015 | $183 | $1,837 | $308 | $1,529 |
| 2014 | $196 | $2,003 | $308 | $1,695 |
Source: Public Records
Map
Nearby Homes