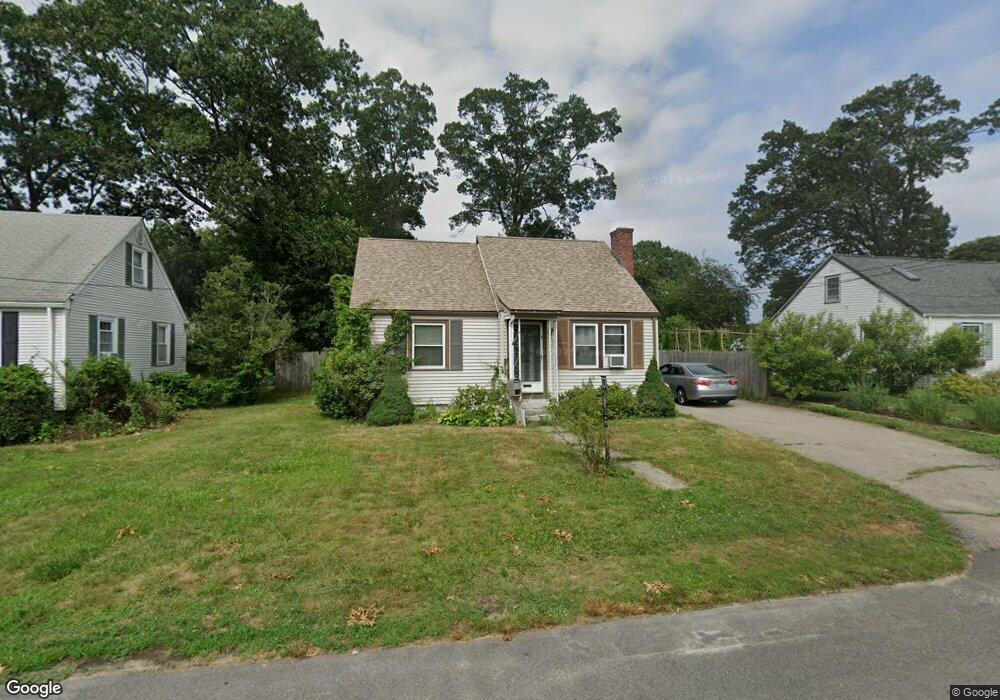
336 Sargent St Warwick, RI 02888
Norwood NeighborhoodEstimated Value: $360,000 - $418,000
4
Beds
1
Bath
1,202
Sq Ft
$318/Sq Ft
Est. Value
About This Home
This home is located at 336 Sargent St, Warwick, RI 02888 and is currently estimated at $382,314, approximately $318 per square foot. 336 Sargent St is a home located in Kent County with nearby schools including Nel/Cps Construction Career, St. Peter School, and Saint Paul School.
Ownership History
Date
Name
Owned For
Owner Type
Purchase Details
Closed on
May 23, 2025
Sold by
Desisto Ft and Desisto
Bought by
Fernandes Kristen M
Current Estimated Value
Purchase Details
Closed on
Dec 18, 2012
Sold by
Desisto John
Bought by
Desisto Jonathan J and Leblanc Pamela
Purchase Details
Closed on
Jun 22, 2007
Sold by
Caimano Edna Est and Caimano
Bought by
Desisto John and Desisto Marie A
Home Financials for this Owner
Home Financials are based on the most recent Mortgage that was taken out on this home.
Original Mortgage
$10,000
Interest Rate
6.14%
Mortgage Type
Purchase Money Mortgage
Create a Home Valuation Report for This Property
The Home Valuation Report is an in-depth analysis detailing your home's value as well as a comparison with similar homes in the area
Home Values in the Area
Average Home Value in this Area
Purchase History
| Date | Buyer | Sale Price | Title Company |
|---|---|---|---|
| Fernandes Kristen M | -- | None Available | |
| Fernandes Kristen M | -- | None Available | |
| Desisto Jonathan J | -- | -- | |
| Desisto Joh | -- | -- | |
| Desisto Jonathan J | -- | -- | |
| Desisto John | $180,000 | -- | |
| Desisto John | $180,000 | -- |
Source: Public Records
Mortgage History
| Date | Status | Borrower | Loan Amount |
|---|---|---|---|
| Previous Owner | Desisto John | $10,000 |
Source: Public Records
Tax History
| Year | Tax Paid | Tax Assessment Tax Assessment Total Assessment is a certain percentage of the fair market value that is determined by local assessors to be the total taxable value of land and additions on the property. | Land | Improvement |
|---|---|---|---|---|
| 2025 | $4,103 | $323,100 | $101,100 | $222,000 |
| 2024 | $3,778 | $261,100 | $87,900 | $173,200 |
| 2023 | $3,705 | $261,100 | $87,900 | $173,200 |
| 2022 | $3,499 | $186,800 | $56,900 | $129,900 |
| 2021 | $3,499 | $186,800 | $56,900 | $129,900 |
| 2020 | $3,499 | $186,800 | $56,900 | $129,900 |
| 2019 | $3,504 | $187,100 | $56,900 | $130,200 |
| 2018 | $3,128 | $150,400 | $56,900 | $93,500 |
| 2017 | $3,044 | $150,400 | $56,900 | $93,500 |
| 2016 | $3,044 | $150,400 | $56,900 | $93,500 |
| 2015 | $2,714 | $130,800 | $55,800 | $75,000 |
| 2014 | $2,624 | $130,800 | $55,800 | $75,000 |
| 2013 | $2,589 | $130,800 | $55,800 | $75,000 |
Source: Public Records
Map
Nearby Homes
- 175 Pettaconsett Ave
- 346 Chestnut St
- 22 Phillips Ave
- 1052 Post Rd
- 90 Massachusetts Ave
- 35 Welfare Ave
- 77 Kentucky Ave
- 228 3rd Ave
- 95 Nolbeth Dr
- 123 Harrington Ave
- 0 Elmwood Ave
- 39 Holiday Ave
- 821 Post Rd
- 80 George St
- 15 Christopher Rhodes Way
- 6 Christopher Rhodes Way
- 150 Riverside Ave
- 6 Seneca St
- 20 Commodore Ave
- 136 Sherwood Ave
Your Personal Tour Guide
Ask me questions while you tour the home.