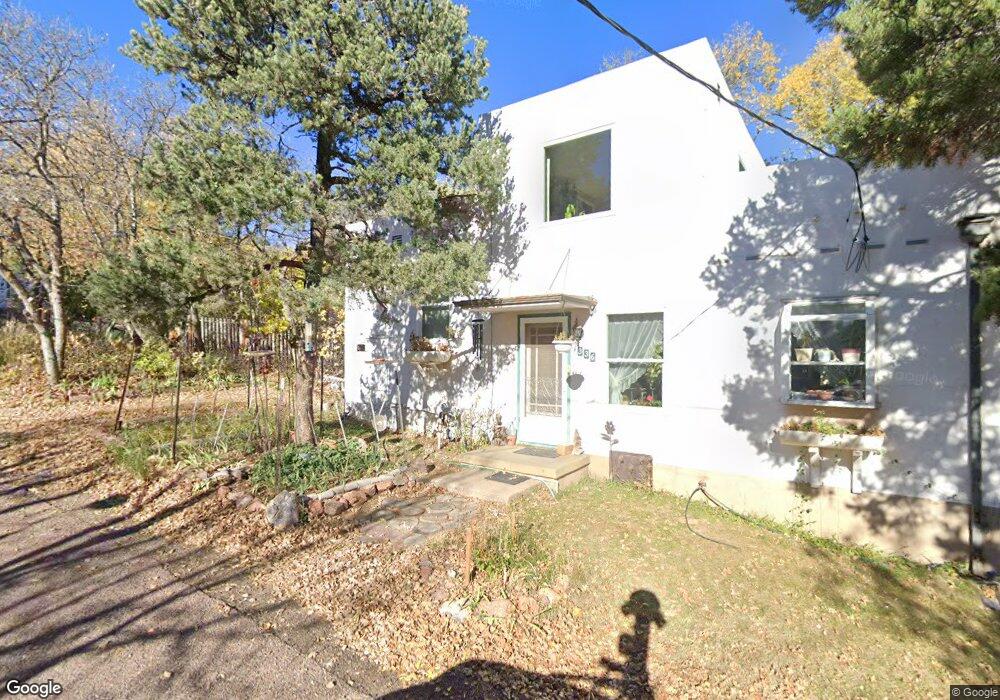
336 Terrace Place Manitou Springs, CO 80829
Estimated Value: $413,000 - $476,000
3
Beds
1
Bath
1,222
Sq Ft
$369/Sq Ft
Est. Value
About This Home
This home is located at 336 Terrace Place, Manitou Springs, CO 80829 and is currently estimated at $451,356, approximately $369 per square foot. 336 Terrace Place is a home located in El Paso County with nearby schools including Manitou Springs Elementary School, Manitou Springs Middle School, and Manitou Springs High School.
Ownership History
Date
Name
Owned For
Owner Type
Purchase Details
Closed on
Jul 29, 2022
Sold by
Make Moves With Mason Llc
Bought by
Pickering Dwight and Wright Kipley
Current Estimated Value
Home Financials for this Owner
Home Financials are based on the most recent Mortgage that was taken out on this home.
Original Mortgage
$336,055
Outstanding Balance
$320,742
Interest Rate
5.3%
Estimated Equity
$130,614
Purchase Details
Closed on
Mar 14, 2022
Sold by
Kanagy Allen D
Bought by
Make Moves With Mason Llc
Home Financials for this Owner
Home Financials are based on the most recent Mortgage that was taken out on this home.
Original Mortgage
$310,000
Interest Rate
3.09%
Mortgage Type
Construction
Purchase Details
Closed on
Aug 4, 1998
Sold by
Kanagy Allen D
Bought by
Kanagy Allen D and Kanagy Bernelle
Purchase Details
Closed on
Jun 26, 1998
Sold by
Willis Kanagy and Willis Martha
Bought by
Kanagy Allen D
Create a Home Valuation Report for This Property
The Home Valuation Report is an in-depth analysis detailing your home's value as well as a comparison with similar homes in the area
Home Values in the Area
Average Home Value in this Area
Purchase History
| Date | Buyer | Sale Price | Title Company |
|---|---|---|---|
| Pickering Dwight | $420,069 | Guardian Title | |
| Make Moves With Mason Llc | $355,000 | Guardian Title | |
| Mcgee John W | $200,000 | Guardian Title | |
| Kanagy Allen D | -- | -- | |
| Kanagy Allen D | $115,000 | -- |
Source: Public Records
Mortgage History
| Date | Status | Borrower | Loan Amount |
|---|---|---|---|
| Open | Pickering Dwight | $336,055 | |
| Previous Owner | Make Moves With Mason Llc | $310,000 |
Source: Public Records
Tax History Compared to Growth
Tax History
| Year | Tax Paid | Tax Assessment Tax Assessment Total Assessment is a certain percentage of the fair market value that is determined by local assessors to be the total taxable value of land and additions on the property. | Land | Improvement |
|---|---|---|---|---|
| 2025 | $1,869 | $29,880 | -- | -- |
| 2024 | $1,697 | $29,200 | $1,990 | $27,210 |
| 2022 | $1,401 | $21,650 | $1,110 | $20,540 |
| 2021 | $1,401 | $25,850 | $4,720 | $21,130 |
| 2020 | $1,133 | $21,560 | $3,930 | $17,630 |
| 2019 | $1,203 | $21,560 | $3,930 | $17,630 |
| 2018 | $1,035 | $18,960 | $3,050 | $15,910 |
| 2017 | $915 | $18,960 | $3,050 | $15,910 |
| 2016 | $819 | $18,490 | $3,060 | $15,430 |
| 2015 | $810 | $18,490 | $3,060 | $15,430 |
| 2014 | $651 | $16,960 | $2,710 | $14,250 |
Source: Public Records
Map
Nearby Homes
- 322 Santa fe Place Unit B
- 18 Taos Place Unit 18
- 107 Oak Place
- 427 Bond St
- 81 Crystal Park Rd Unit A
- 0 El Paso Blvd Unit REC3533719
- 0 El Paso Blvd
- 144 Crystal Park Rd
- LOTS 1-10 Peakview Blvd
- 478 El Paso Blvd
- 135 South Path
- 34 Fountain Place
- 154 El Paso Blvd
- 103 Deer Path Ave
- 0 Clarksley Rd
- 328 Sutherland Place
- 121 Via San Miguel
- 105 Pawnee Ave
- 7 Escondido Valle
- 327 Clarksley Rd
- 342 Terrace Place
- 341 Plainview Place
- 335 Terrace Place
- 343 Plainview Place
- 333 Terrace Place
- 0 Grandview Place
- 331 Terrace Place
- 336 Grandview Place
- 100 Grandview Place
- 342 Plainview Place
- 344 Plainview Place
- 333 Plainview Place
- 347 Plainview Place
- 348 Plainview Place
- 338 Plainview Place
- 327 Terrace Place
- 352 Plainview Place
- 329 Grandview Place
- 324 Terrace Place
- 323 Terrace Place