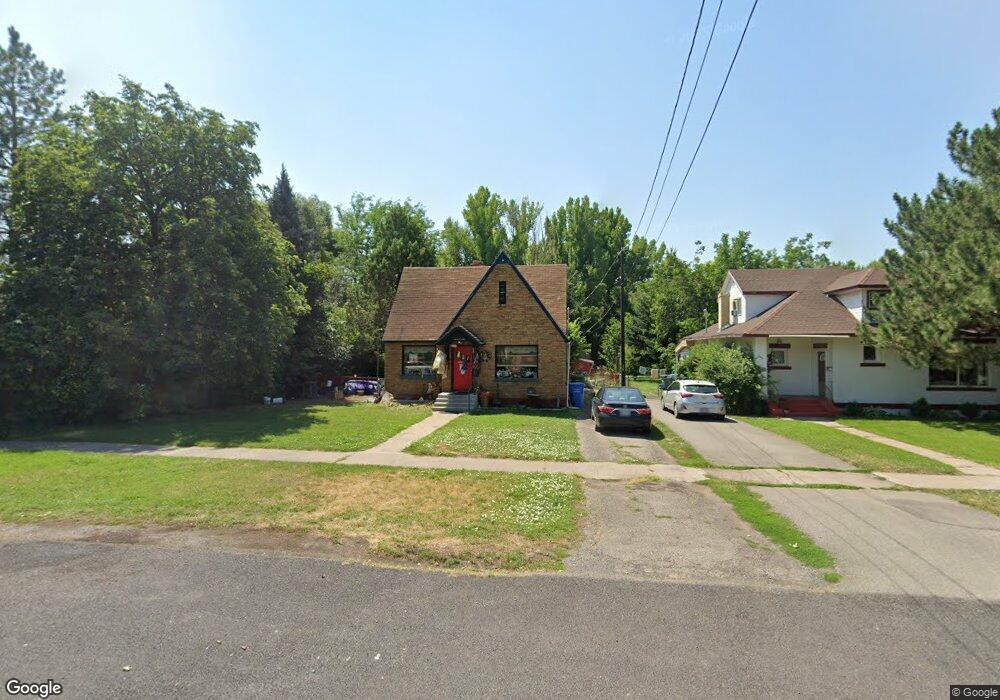
336 W 200 S Logan, UT 84321
Woodruff NeighborhoodEstimated Value: $343,000 - $367,000
--
Bed
--
Bath
1,468
Sq Ft
$243/Sq Ft
Est. Value
About This Home
This home is located at 336 W 200 S, Logan, UT 84321 and is currently estimated at $356,339, approximately $242 per square foot. 336 W 200 S is a home with nearby schools including Woodruff School, Mount Logan Middle School, and Logan High School.
Ownership History
Date
Name
Owned For
Owner Type
Purchase Details
Closed on
Jul 25, 2017
Sold by
Christensen Jackie
Bought by
Christensen Jackie
Current Estimated Value
Home Financials for this Owner
Home Financials are based on the most recent Mortgage that was taken out on this home.
Original Mortgage
$164,326
Outstanding Balance
$136,120
Interest Rate
3.87%
Mortgage Type
FHA
Estimated Equity
$220,219
Purchase Details
Closed on
Jul 28, 2015
Sold by
Christensen Jessica E and Christensen Jackie E
Bought by
Christensen Jackie
Home Financials for this Owner
Home Financials are based on the most recent Mortgage that was taken out on this home.
Original Mortgage
$125,000
Interest Rate
3.98%
Mortgage Type
New Conventional
Purchase Details
Closed on
Aug 1, 2014
Sold by
Christensen Jessica E
Bought by
Christensen Jessica E and Christensen Jackie E
Purchase Details
Closed on
May 1, 2009
Sold by
Christensen Jackie E and Christensen Jacqueline E
Bought by
Christensen Jessica E
Purchase Details
Closed on
Jan 23, 2009
Sold by
Christensen Jessica E
Bought by
Christensen Jessica E and Christensen Jackie E
Home Financials for this Owner
Home Financials are based on the most recent Mortgage that was taken out on this home.
Original Mortgage
$119,732
Interest Rate
5.14%
Mortgage Type
FHA
Purchase Details
Closed on
Jul 23, 2008
Sold by
Christensen Jessica
Bought by
Christensen Jessica E
Home Financials for this Owner
Home Financials are based on the most recent Mortgage that was taken out on this home.
Original Mortgage
$117,963
Interest Rate
6.41%
Mortgage Type
FHA
Purchase Details
Closed on
Aug 11, 2005
Sold by
Archibald Josh
Bought by
Christensen Jessica
Home Financials for this Owner
Home Financials are based on the most recent Mortgage that was taken out on this home.
Original Mortgage
$114,500
Interest Rate
6.95%
Mortgage Type
New Conventional
Create a Home Valuation Report for This Property
The Home Valuation Report is an in-depth analysis detailing your home's value as well as a comparison with similar homes in the area
Home Values in the Area
Average Home Value in this Area
Purchase History
| Date | Buyer | Sale Price | Title Company |
|---|---|---|---|
| Christensen Jackie | -- | None Available | |
| Christensen Jackie | -- | Pinnacle Title Ins Agency | |
| Christensen Jessica E | -- | Hickman Land Title Company | |
| Christensen Jessica E | -- | Accommodation | |
| Christensen Jessica E | -- | Pinnacle Title Ins Agency | |
| Christensen Jessica E | -- | Pinnacle Title Ins Agency | |
| Christensen Jessica E | -- | Pinnacle Title Ins Agency | |
| Christensen Jessica | -- | Advanced Title Co |
Source: Public Records
Mortgage History
| Date | Status | Borrower | Loan Amount |
|---|---|---|---|
| Open | Christensen Jackie | $164,326 | |
| Previous Owner | Christensen Jackie | $125,000 | |
| Previous Owner | Christensen Jessica E | $119,732 | |
| Previous Owner | Christensen Jessica E | $117,963 | |
| Previous Owner | Christensen Jessica | $114,500 |
Source: Public Records
Tax History Compared to Growth
Tax History
| Year | Tax Paid | Tax Assessment Tax Assessment Total Assessment is a certain percentage of the fair market value that is determined by local assessors to be the total taxable value of land and additions on the property. | Land | Improvement |
|---|---|---|---|---|
| 2025 | $1,589 | $205,470 | $0 | $0 |
| 2024 | $1,631 | $204,265 | $0 | $0 |
| 2023 | $1,706 | $203,690 | $0 | $0 |
| 2022 | $1,565 | $174,455 | $0 | $0 |
| 2021 | $1,385 | $238,560 | $42,000 | $196,560 |
| 2020 | $1,246 | $193,200 | $42,000 | $151,200 |
| 2019 | $1,303 | $193,200 | $42,000 | $151,200 |
| 2018 | $1,307 | $177,000 | $42,000 | $135,000 |
| 2017 | $1,231 | $88,110 | $0 | $0 |
| 2016 | $1,276 | $88,110 | $0 | $0 |
| 2015 | $1,277 | $88,110 | $0 | $0 |
| 2014 | $1,155 | $88,110 | $0 | $0 |
| 2013 | -- | $88,110 | $0 | $0 |
Source: Public Records
Map
Nearby Homes