Estimated Value: $348,000 - $398,000
4
Beds
1
Bath
872
Sq Ft
$429/Sq Ft
Est. Value
About This Home
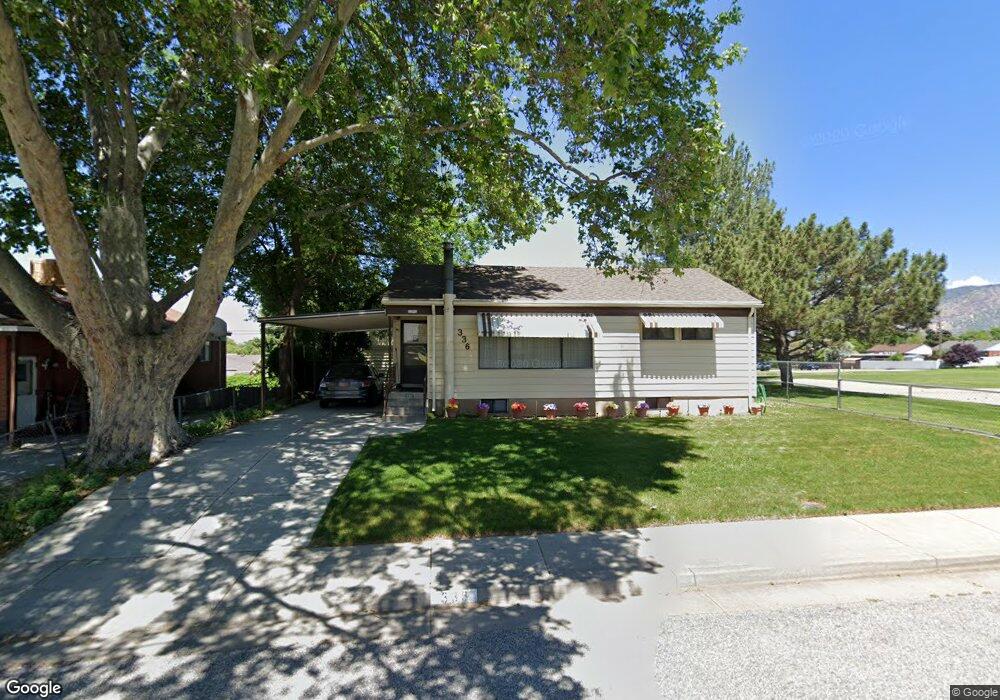
This home is located at 336 W 4725 S, Ogden, UT 84405 and is currently estimated at $374,274, approximately $429 per square foot. 336 W 4725 S is a home located in Weber County with nearby schools including Washington Terrace School, T.H. Bell Junior High School, and Bonneville High School.
Ownership History
Date
Name
Owned For
Owner Type
Purchase Details
Closed on
Jun 21, 2022
Sold by
Barbara Nelson Trust and Nelson Barbara
Bought by
Barbara Nelson Trust and Nelson
Current Estimated Value
Home Financials for this Owner
Home Financials are based on the most recent Mortgage that was taken out on this home.
Original Mortgage
$237,500
Outstanding Balance
$225,943
Interest Rate
5.25%
Mortgage Type
New Conventional
Estimated Equity
$148,331
Purchase Details
Closed on
Nov 8, 2016
Sold by
Nelson Barbara and Evans Carol Nelson
Bought by
Nelson Barbara and The Barbara Nelson Trust
Create a Home Valuation Report for This Property
The Home Valuation Report is an in-depth analysis detailing your home's value as well as a comparison with similar homes in the area
Home Values in the Area
Average Home Value in this Area
Purchase History
| Date | Buyer | Sale Price | Title Company |
|---|---|---|---|
| Barbara Nelson Trust | -- | None Listed On Document | |
| Nelson Barbara | -- | None Available |
Source: Public Records
Mortgage History
| Date | Status | Borrower | Loan Amount |
|---|---|---|---|
| Open | Barbara Nelson Trust | $237,500 |
Source: Public Records
Tax History Compared to Growth
Tax History
| Year | Tax Paid | Tax Assessment Tax Assessment Total Assessment is a certain percentage of the fair market value that is determined by local assessors to be the total taxable value of land and additions on the property. | Land | Improvement |
|---|---|---|---|---|
| 2025 | $2,526 | $373,619 | $110,006 | $263,613 |
| 2024 | $2,395 | $199,098 | $60,503 | $138,595 |
| 2023 | $2,254 | $186,451 | $60,429 | $126,022 |
| 2022 | $2,456 | $212,850 | $57,750 | $155,100 |
| 2021 | $1,948 | $272,000 | $54,991 | $217,009 |
| 2020 | $1,061 | $252,000 | $45,055 | $206,945 |
| 2019 | $1,014 | $220,999 | $45,055 | $175,944 |
| 2018 | $874 | $187,001 | $45,055 | $141,946 |
| 2017 | $763 | $149,999 | $29,990 | $120,009 |
| 2016 | $694 | $75,152 | $16,560 | $58,592 |
| 2015 | $705 | $75,152 | $16,560 | $58,592 |
| 2014 | $645 | $68,528 | $16,560 | $51,968 |
Source: Public Records
Map
Nearby Homes
- 396 W 4675 S
- 4617 S 450 W
- 4598 S 450 W
- 358 W 4575 S
- 4610 S 250 W
- 235 W 4600 S
- 4506 S 300 W
- 193 W 4650 S
- 4856 S 300 W
- 4931 S 300 W
- 4360 S 275 W
- 203 W 4900 S Unit 3
- 246 W 5000 S
- 390 W 5050 S
- 480 W 5050 S
- 493 W 5100 S
- 445 W 5100 S
- 4375 Weber River Dr Unit 44
- 4375 Weber River Dr Unit 123
- 4375 Weber River Dr Unit 55