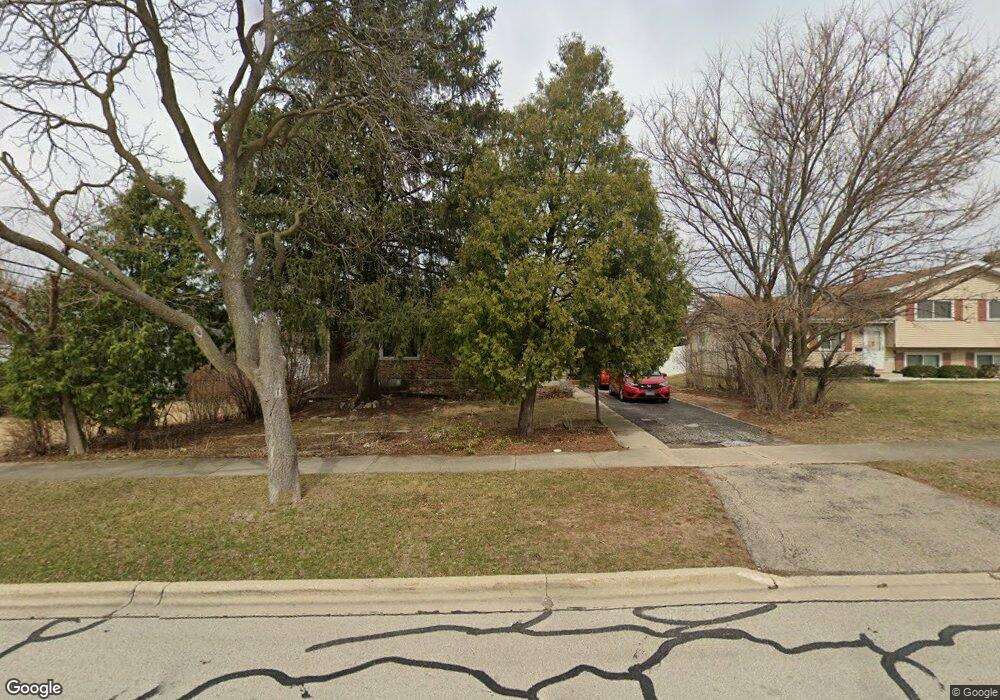
336 W Harding Rd Lombard, IL 60148
North Lombard NeighborhoodEstimated Value: $358,000 - $390,000
3
Beds
2
Baths
1,073
Sq Ft
$349/Sq Ft
Est. Value
About This Home
This home is located at 336 W Harding Rd, Lombard, IL 60148 and is currently estimated at $374,210, approximately $348 per square foot. 336 W Harding Rd is a home located in DuPage County with nearby schools including Madison Elementary School, Wm Hammerschmidt Elementary School, and Pleasant Lane Elementary School.
Ownership History
Date
Name
Owned For
Owner Type
Purchase Details
Closed on
Oct 8, 2024
Sold by
Jurek Kelly M and Jurek Ronald J
Bought by
Jurek Family Trust and Jurek
Current Estimated Value
Purchase Details
Closed on
Nov 6, 2009
Sold by
Jurek Kelly M and Jurek Ronald J
Bought by
Jurek Kelly M and Jurek Ronald J
Home Financials for this Owner
Home Financials are based on the most recent Mortgage that was taken out on this home.
Original Mortgage
$228,679
Interest Rate
5.05%
Mortgage Type
FHA
Purchase Details
Closed on
Nov 4, 2008
Sold by
Snobeck Rolf G and Snobeck Rebecca A
Bought by
Griffin Kelly M
Home Financials for this Owner
Home Financials are based on the most recent Mortgage that was taken out on this home.
Original Mortgage
$227,355
Interest Rate
5.95%
Mortgage Type
FHA
Create a Home Valuation Report for This Property
The Home Valuation Report is an in-depth analysis detailing your home's value as well as a comparison with similar homes in the area
Home Values in the Area
Average Home Value in this Area
Purchase History
| Date | Buyer | Sale Price | Title Company |
|---|---|---|---|
| Jurek Family Trust | -- | None Listed On Document | |
| Jurek Kelly M | -- | Citywide Title Corporation | |
| Griffin Kelly M | $230,000 | First American Title |
Source: Public Records
Mortgage History
| Date | Status | Borrower | Loan Amount |
|---|---|---|---|
| Previous Owner | Jurek Kelly M | $228,679 | |
| Previous Owner | Griffin Kelly M | $227,355 |
Source: Public Records
Tax History Compared to Growth
Tax History
| Year | Tax Paid | Tax Assessment Tax Assessment Total Assessment is a certain percentage of the fair market value that is determined by local assessors to be the total taxable value of land and additions on the property. | Land | Improvement |
|---|---|---|---|---|
| 2024 | $6,383 | $90,157 | $27,165 | $62,992 |
| 2023 | $6,061 | $83,370 | $25,120 | $58,250 |
| 2022 | $5,916 | $80,140 | $24,140 | $56,000 |
| 2021 | $5,728 | $78,150 | $23,540 | $54,610 |
| 2020 | $5,605 | $76,430 | $23,020 | $53,410 |
| 2019 | $5,319 | $72,670 | $21,890 | $50,780 |
| 2018 | $5,026 | $66,550 | $31,980 | $34,570 |
| 2017 | $4,876 | $63,410 | $30,470 | $32,940 |
| 2016 | $4,733 | $59,730 | $28,700 | $31,030 |
| 2015 | $4,883 | $60,350 | $26,740 | $33,610 |
| 2014 | $4,755 | $57,390 | $32,560 | $24,830 |
| 2013 | $4,685 | $58,200 | $33,020 | $25,180 |
Source: Public Records
Map
Nearby Homes
- 564 W Harrison Rd
- 6 W Harding Rd
- 465 S Elizabeth St
- 250 St Regis
- 22 W Graham Ave
- 407 S Brewster Ave
- 635 S Charlotte St
- 337 S Brewster Ave
- 408 S Miller Ct
- 185 W Hickory Rd
- 927 S Charlotte St
- 610 Hammerschmidt Ave
- 14931 Parkview Blvd
- 1133 S Finley Rd Unit 410
- 1053 S Norbury Ave
- 914 S Lombard Ave
- 1 S Lincoln Ave Unit 301
- 570 S Fairfield Ave
- 82 Valley Rd
- 819 S Fairfield Ave
- 330 W Harding Rd
- 340 W Harding Rd
- 324 W Harding Rd
- 346 W Harding Rd
- 350 W Harding Rd
- 320 W Harding Rd
- 341 W Harding Rd
- 331 W Harding Rd
- 335 W Harding Rd
- 325 W Harding Rd
- 314 W Harding Rd
- 345 W Harding Rd
- 645 S Edson Ave
- 635 S Edson Ave
- 319 W Harding Rd
- 308 W Harding Rd
- 317 W Harding Rd
- 355 W Harding Rd
- 629 S Edson Ave
- 324 W Harrison Rd