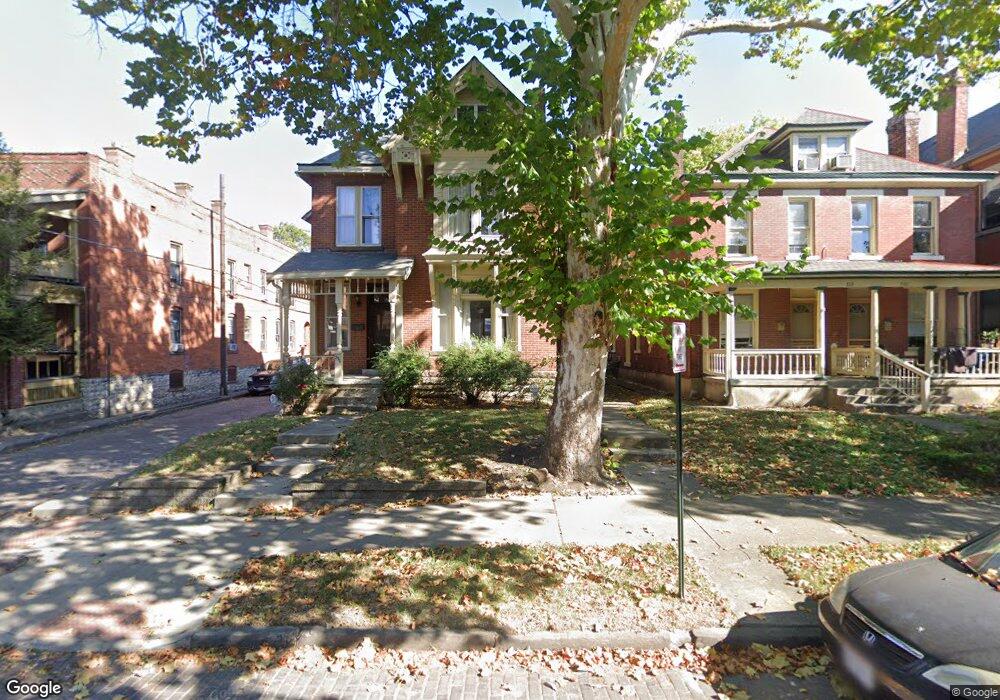
336 W Hubbard Ave Unit 338 Columbus, OH 43215
Victorian Village NeighborhoodEstimated Value: $671,000 - $784,000
5
Beds
2
Baths
3,156
Sq Ft
$231/Sq Ft
Est. Value
About This Home
This home is located at 336 W Hubbard Ave Unit 338, Columbus, OH 43215 and is currently estimated at $729,254, approximately $231 per square foot. 336 W Hubbard Ave Unit 338 is a home located in Franklin County with nearby schools including Hubbard Elementary School, Dominion Middle School, and Whetstone High School.
Ownership History
Date
Name
Owned For
Owner Type
Purchase Details
Closed on
Aug 15, 2024
Sold by
Campbell Carly
Bought by
Cc 3368 W Hubbard Ave Llc
Current Estimated Value
Purchase Details
Closed on
Oct 28, 2022
Sold by
Amended Robert H Herbst Jr 1997 and Amended Restat
Bought by
Campbell Carly
Home Financials for this Owner
Home Financials are based on the most recent Mortgage that was taken out on this home.
Original Mortgage
$536,750
Interest Rate
4.63%
Mortgage Type
New Conventional
Purchase Details
Closed on
Dec 5, 2008
Sold by
Herbst Robert and Herbst Barbara
Bought by
Herbst Robert H and Robert H Herbst Jr 1997 Amended & Restat
Purchase Details
Closed on
Aug 2, 1977
Bought by
Herbst Robert H
Create a Home Valuation Report for This Property
The Home Valuation Report is an in-depth analysis detailing your home's value as well as a comparison with similar homes in the area
Home Values in the Area
Average Home Value in this Area
Purchase History
| Date | Buyer | Sale Price | Title Company |
|---|---|---|---|
| Cc 3368 W Hubbard Ave Llc | -- | Empora Title | |
| Campbell Carly | $565,000 | Great American Title | |
| Herbst Robert H | -- | Attorney | |
| Herbst Robert H | -- | -- |
Source: Public Records
Mortgage History
| Date | Status | Borrower | Loan Amount |
|---|---|---|---|
| Previous Owner | Campbell Carly | $536,750 |
Source: Public Records
Tax History Compared to Growth
Tax History
| Year | Tax Paid | Tax Assessment Tax Assessment Total Assessment is a certain percentage of the fair market value that is determined by local assessors to be the total taxable value of land and additions on the property. | Land | Improvement |
|---|---|---|---|---|
| 2024 | $8,527 | $188,020 | $77,000 | $111,020 |
| 2023 | $8,570 | $188,020 | $77,000 | $111,020 |
| 2022 | $8,605 | $161,920 | $35,740 | $126,180 |
| 2021 | $8,620 | $161,920 | $35,740 | $126,180 |
| 2020 | $8,633 | $161,920 | $35,740 | $126,180 |
| 2019 | $8,390 | $134,930 | $29,790 | $105,140 |
| 2018 | $7,620 | $134,930 | $29,790 | $105,140 |
| 2017 | $8,388 | $134,930 | $29,790 | $105,140 |
| 2016 | $7,540 | $110,990 | $26,180 | $84,810 |
| 2015 | $6,865 | $110,990 | $26,180 | $84,810 |
| 2014 | $6,882 | $110,990 | $26,180 | $84,810 |
| 2013 | $3,086 | $100,905 | $23,800 | $77,105 |
Source: Public Records
Map
Nearby Homes
- 867-871 Delaware Ave
- 313 W 1st Ave
- 312 Buttles Ave Unit 314
- 884 Neil Ave
- 994 Harrison Ave
- 319 W 2nd Ave Unit 319
- 938 Hunter Ave
- 1003 Pennsylvania Ave Unit 5
- 986 Highland St
- 969 Hunter Ave
- 1018 Neil Ave
- 1016 Neil Ave
- 915 Dennison Ave Unit 915
- 337 Tappan St
- 1042 Neil Ave
- 925 Ingleside Ave Unit 111
- 925 Ingleside Ave Unit 213
- 925 Ingleside Ave Unit 303
- 496 W 1st Ave
- 953 Ingleside Ave Unit 314
- 336 W Hubbard Ave Unit 8
- 332 W Hubbard Ave
- 330 W Hubbard Ave Unit 332
- 326 W Hubbard Ave Unit 328
- 866 Delaware Ave
- 350 W Hubbard Ave
- 322 W Hubbard Ave
- 352 W Hubbard Ave
- 867 Delaware Ave Unit 871
- 869 Delaware Ave
- 871 Delaware Ave
- 354 W Hubbard Ave Unit 354
- 318 W Hubbard Ave Unit 320
- 356 W Hubbard Ave Unit 356
- 323 Wilber Ave
- 337 W Hubbard Ave Unit 337
- 339 W Hubbard Ave Unit 339
- 321 Wilber Ave
- 312 W Hubbard Ave
- 360 W Hubbard Ave Unit 362