3360 184th St Unit 3360A Homewood, IL 60430
Estimated Value: $135,000 - $140,092
2
Beds
2
Baths
900
Sq Ft
$153/Sq Ft
Est. Value
About This Home
This home is located at 3360 184th St Unit 3360A, Homewood, IL 60430 and is currently estimated at $137,773, approximately $153 per square foot. 3360 184th St Unit 3360A is a home located in Cook County with nearby schools including Flossmoor Hills Elementary School, Parker Junior High School, and Homewood-Flossmoor High School.
Ownership History
Date
Name
Owned For
Owner Type
Purchase Details
Closed on
Aug 11, 2022
Sold by
Maxwell Mark S
Bought by
Banks Jordeh V and Banks Sandra
Current Estimated Value
Purchase Details
Closed on
Nov 10, 2005
Sold by
Barrett Daniel and Settanni Tracy
Bought by
Maxwell Mark S
Home Financials for this Owner
Home Financials are based on the most recent Mortgage that was taken out on this home.
Original Mortgage
$110,580
Interest Rate
6.17%
Mortgage Type
Fannie Mae Freddie Mac
Purchase Details
Closed on
May 25, 2001
Sold by
Letellier Material Handling Equipment In
Bought by
Barrett Daniel and Niehaus Tracey
Home Financials for this Owner
Home Financials are based on the most recent Mortgage that was taken out on this home.
Original Mortgage
$66,930
Interest Rate
7.18%
Create a Home Valuation Report for This Property
The Home Valuation Report is an in-depth analysis detailing your home's value as well as a comparison with similar homes in the area
Home Values in the Area
Average Home Value in this Area
Purchase History
| Date | Buyer | Sale Price | Title Company |
|---|---|---|---|
| Banks Jordeh V | $110,000 | First American Title | |
| Maxwell Mark S | $114,000 | Git | |
| Barrett Daniel | $69,000 | -- |
Source: Public Records
Mortgage History
| Date | Status | Borrower | Loan Amount |
|---|---|---|---|
| Previous Owner | Maxwell Mark S | $110,580 | |
| Previous Owner | Barrett Daniel | $66,930 |
Source: Public Records
Tax History Compared to Growth
Tax History
| Year | Tax Paid | Tax Assessment Tax Assessment Total Assessment is a certain percentage of the fair market value that is determined by local assessors to be the total taxable value of land and additions on the property. | Land | Improvement |
|---|---|---|---|---|
| 2024 | $2,635 | $10,013 | $1,699 | $8,314 |
| 2023 | $1,770 | $10,012 | $1,698 | $8,314 |
| 2022 | $1,770 | $6,950 | $1,486 | $5,464 |
| 2021 | $1,817 | $6,949 | $1,486 | $5,463 |
| 2020 | $1,857 | $6,949 | $1,486 | $5,463 |
| 2019 | $1,361 | $6,128 | $1,344 | $4,784 |
| 2018 | $1,324 | $6,128 | $1,344 | $4,784 |
| 2017 | $1,331 | $6,128 | $1,344 | $4,784 |
| 2016 | $1,572 | $5,646 | $1,203 | $4,443 |
| 2015 | $1,513 | $5,646 | $1,203 | $4,443 |
| 2014 | $1,511 | $5,646 | $1,203 | $4,443 |
| 2013 | $2,508 | $8,201 | $1,203 | $6,998 |
Source: Public Records
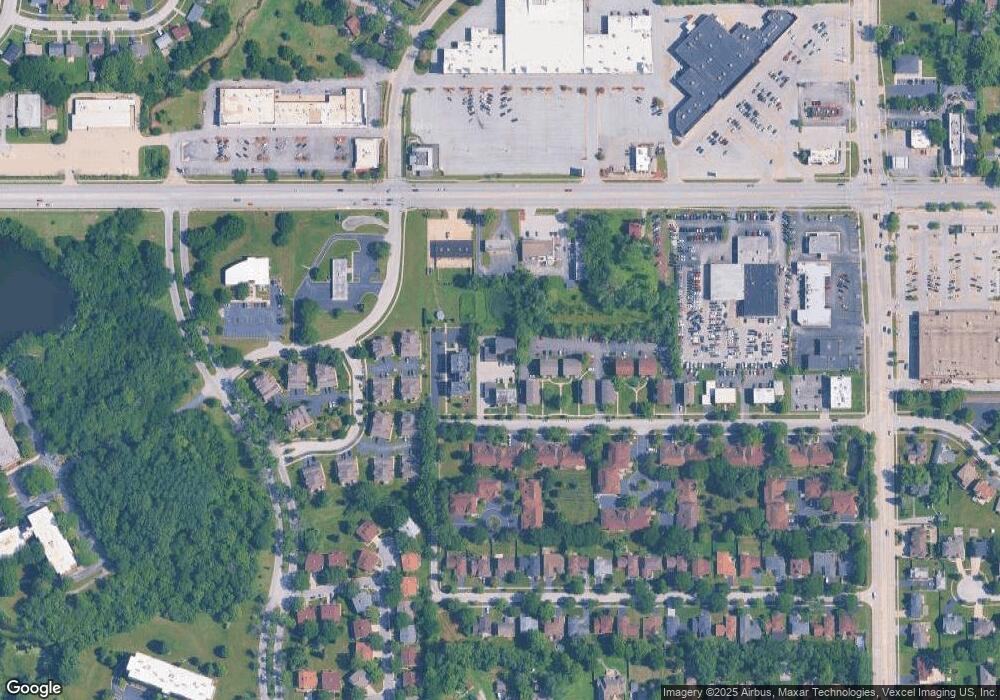
Map
Nearby Homes
- 3360 184th St Unit 3W
- 3255 183rd St
- 18107 Kedzie Ave
- 18445 Kedzie Ave
- 18600 Village West Dr Unit 310
- 18600 Village West Dr Unit 206
- 3505 Lakeview Dr Unit 204
- 18120 Versailles Ln
- 18622 Golfview Dr
- 3048 Matthew Ln Unit B3
- 3400 Seine Ct
- 18650 Golfview Dr
- 18638 Golfview Dr
- 3406 Seine Ct
- 3525 Marseilles Ln
- 18623 Augusta Ln
- 18106 Charlemagne Ave
- 18208 Fountainbleau Dr
- 3411 Montmarte Ave
- 18310 Robin Ln Unit D2
- 3360 184th St Unit 3360E
- 3360 184th St Unit 3360D
- 3360 184th St Unit 3360C
- 3360 184th St Unit 3360B
- 3360 184th St Unit 3360F
- 3360 184th St
- 3360 184th St Unit 2W
- 3360 184th St Unit 1A
- 3360 184th St Unit 2C
- 3358 184th St Unit 3358B
- 3358 184th St Unit 3358C
- 3358 184th St Unit 3358D
- 3358 184th St Unit 3358A
- 3358 184th St Unit 3358E
- 3358 184th St Unit 3358F
- 3358 184th St Unit A
- 3358 184th St Unit 2C
- 3358 W 184th St Unit 1B
- 3358 184th St Unit 3F
- 3358 184th St Unit 1B