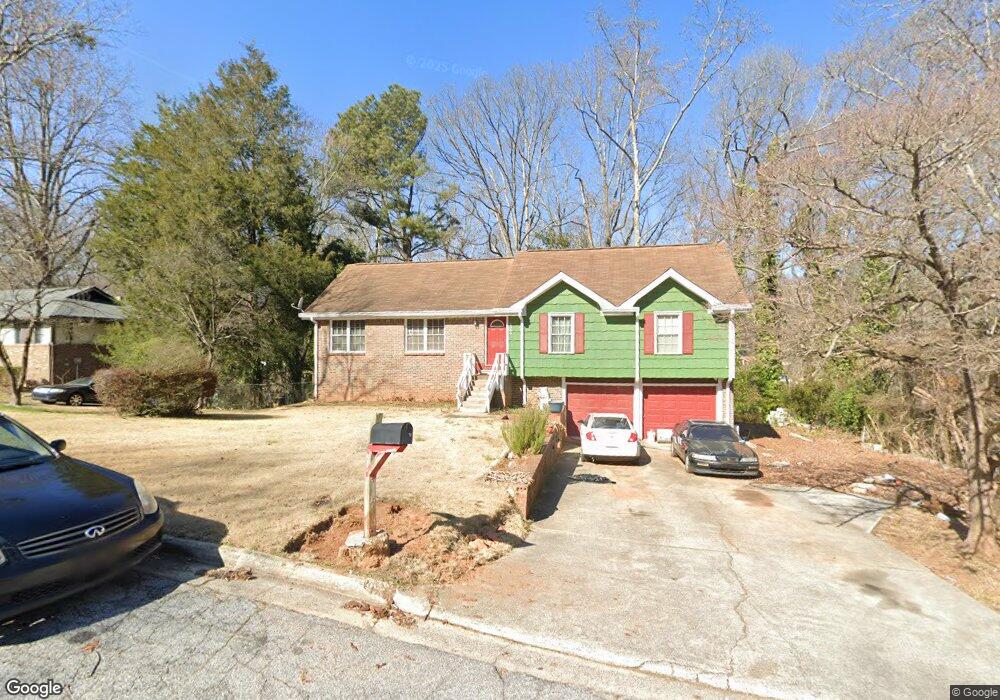
3360 Herrenhut Rd Lithonia, GA 30038
Estimated Value: $206,280 - $261,000
4
Beds
2
Baths
1,474
Sq Ft
$162/Sq Ft
Est. Value
About This Home
This home is located at 3360 Herrenhut Rd, Lithonia, GA 30038 and is currently estimated at $238,820, approximately $162 per square foot. 3360 Herrenhut Rd is a home located in DeKalb County with nearby schools including Browns Mill Elementary School, Salem Middle School, and Martin Luther King- Jr. High School.
Ownership History
Date
Name
Owned For
Owner Type
Purchase Details
Closed on
Feb 11, 2019
Sold by
Cooper Deslyn P
Bought by
Cooper Sadiah S
Current Estimated Value
Purchase Details
Closed on
Nov 6, 2018
Sold by
Nantambu Azikiwe
Bought by
Cooper Deslyn
Purchase Details
Closed on
Nov 14, 2006
Sold by
Wilson Hubert
Bought by
Wilson Hubert and Nantambu Azikiwe
Home Financials for this Owner
Home Financials are based on the most recent Mortgage that was taken out on this home.
Original Mortgage
$99,200
Interest Rate
6.36%
Mortgage Type
New Conventional
Purchase Details
Closed on
Jun 6, 2006
Sold by
Douglas Emilce P
Bought by
Jp Morgan Chase Bk
Purchase Details
Closed on
Oct 11, 2002
Sold by
Porter Kevin P and Porter Roslyn R
Bought by
Douglas Emilce P
Home Financials for this Owner
Home Financials are based on the most recent Mortgage that was taken out on this home.
Original Mortgage
$126,950
Interest Rate
6.25%
Mortgage Type
New Conventional
Create a Home Valuation Report for This Property
The Home Valuation Report is an in-depth analysis detailing your home's value as well as a comparison with similar homes in the area
Home Values in the Area
Average Home Value in this Area
Purchase History
| Date | Buyer | Sale Price | Title Company |
|---|---|---|---|
| Cooper Sadiah S | -- | -- | |
| Cooper Deslyn | -- | -- | |
| Wilson Hubert | -- | -- | |
| Wilson Hubert | $124,000 | -- | |
| Jp Morgan Chase Bk | $124,950 | -- | |
| Douglas Emilce P | $130,900 | -- |
Source: Public Records
Mortgage History
| Date | Status | Borrower | Loan Amount |
|---|---|---|---|
| Previous Owner | Wilson Hubert | $99,200 | |
| Previous Owner | Douglas Emilce P | $126,950 |
Source: Public Records
Tax History Compared to Growth
Tax History
| Year | Tax Paid | Tax Assessment Tax Assessment Total Assessment is a certain percentage of the fair market value that is determined by local assessors to be the total taxable value of land and additions on the property. | Land | Improvement |
|---|---|---|---|---|
| 2025 | $4,336 | $87,480 | $11,000 | $76,480 |
| 2024 | $4,315 | $87,680 | $11,000 | $76,680 |
| 2023 | $4,315 | $91,480 | $11,000 | $80,480 |
| 2022 | $3,563 | $73,960 | $5,440 | $68,520 |
| 2021 | $2,707 | $53,640 | $5,440 | $48,200 |
| 2020 | $2,176 | $42,160 | $5,440 | $36,720 |
| 2019 | $1,712 | $31,880 | $5,440 | $26,440 |
| 2018 | $959 | $31,880 | $5,440 | $26,440 |
| 2017 | $735 | $23,320 | $5,440 | $17,880 |
| 2016 | $450 | $15,520 | $5,440 | $10,080 |
| 2014 | $891 | $28,320 | $5,440 | $22,880 |
Source: Public Records
Map
Nearby Homes
- 3352 Herrenhut Rd
- 3333 Saxony Way
- 3262 Moravia Dr
- 3272 Corktree Trail
- 3267 Forrest Bluff Way
- 3202 Herrenhut Rd
- 3605 Portsmouth Cir
- 3540 Framingham Dr
- 3235 Wintercreeper Dr
- 5058 Rock Springs Rd
- 4715 Wildginger Run
- 3554 Portsmouth Cir
- 3468 Deer Trace
- 4922 Rock Springs Rd
- 3589 Burlingham Dr Unit 1
- 3152 Meadow Glade Ct
- 5074 Great Meadows Rd
- 4734 Eagles Ridge Loop
- 4603 Jackybell Trail
- 4992 Needle Knob Ct
- 3368 Herrenhut Rd
- 3325 Saxony Way
- 3344 Herrenhut Rd
- 3376 Herrenhut Rd
- 3319 Saxony Way
- 3359 Herrenhut Rd
- 3351 Herrenhut Rd
- 3313 Saxony Way
- 3367 Herrenhut Rd
- 3341 Saxony Way Unit 3341
- 3341 Saxony Way
- 3341 Saxony Way
- 3336 Herrenhut Rd
- 3343 Herrenhut Rd
- 3384 Herrenhut Rd
- 3383 Herrenhut Rd Unit 6
- 3383 Herrenhut Rd
- 3335 Herrenhut Rd
- 3357 Saxony Way
- 3307 Saxony Way