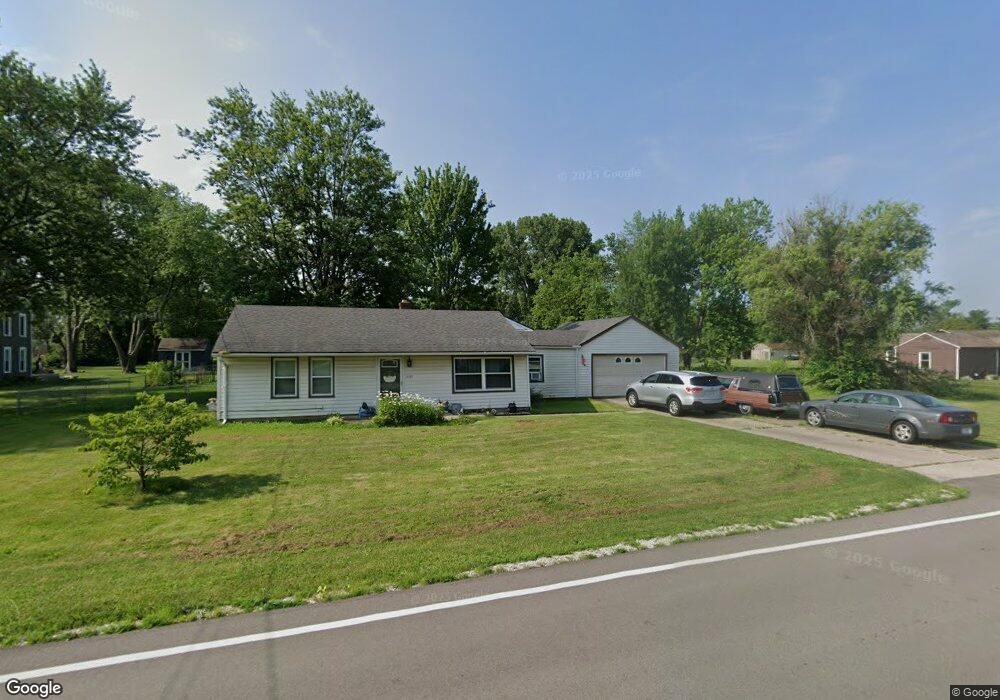
3360 Hertlein Ln Vandalia, OH 45377
Estimated Value: $243,000 - $294,000
3
Beds
2
Baths
1,670
Sq Ft
$165/Sq Ft
Est. Value
About This Home
This home is located at 3360 Hertlein Ln, Vandalia, OH 45377 and is currently estimated at $276,139, approximately $165 per square foot. 3360 Hertlein Ln is a home located in Montgomery County with nearby schools including Helke Elementary School, Morton Middle School, and Butler High School.
Ownership History
Date
Name
Owned For
Owner Type
Purchase Details
Closed on
Aug 1, 2018
Sold by
Rivera Robert Louis
Bought by
Rivera Rebecca Renee
Current Estimated Value
Purchase Details
Closed on
Oct 14, 2016
Sold by
Belinda D Curtner
Bought by
Rivera Robert and Rivera Rebecca
Home Financials for this Owner
Home Financials are based on the most recent Mortgage that was taken out on this home.
Original Mortgage
$108,770
Outstanding Balance
$87,227
Interest Rate
3.47%
Estimated Equity
$188,912
Purchase Details
Closed on
Oct 13, 2016
Sold by
Forbeck Belinda D
Bought by
Robert Louis Rivera
Home Financials for this Owner
Home Financials are based on the most recent Mortgage that was taken out on this home.
Original Mortgage
$108,770
Outstanding Balance
$87,227
Interest Rate
3.47%
Estimated Equity
$188,912
Purchase Details
Closed on
Jun 24, 2011
Sold by
Curtner Betty V
Bought by
Forbeck Belinda D and Forbeck David A
Create a Home Valuation Report for This Property
The Home Valuation Report is an in-depth analysis detailing your home's value as well as a comparison with similar homes in the area
Home Values in the Area
Average Home Value in this Area
Purchase History
| Date | Buyer | Sale Price | Title Company |
|---|---|---|---|
| Rivera Rebecca Renee | -- | None Available | |
| Rivera Robert | -- | -- | |
| Robert Louis Rivera | -- | -- | |
| Forbeck Belinda D | -- | Attorney |
Source: Public Records
Mortgage History
| Date | Status | Borrower | Loan Amount |
|---|---|---|---|
| Open | Robert Louis Rivera | $108,770 | |
| Closed | Robert Louis Rivera | -- | |
| Closed | Robert Louis Rivera | -- |
Source: Public Records
Tax History Compared to Growth
Tax History
| Year | Tax Paid | Tax Assessment Tax Assessment Total Assessment is a certain percentage of the fair market value that is determined by local assessors to be the total taxable value of land and additions on the property. | Land | Improvement |
|---|---|---|---|---|
| 2024 | $3,741 | $59,280 | $21,400 | $37,880 |
| 2023 | $3,741 | $59,280 | $21,400 | $37,880 |
| 2022 | $3,620 | $45,710 | $16,460 | $29,250 |
| 2021 | $3,621 | $45,710 | $16,460 | $29,250 |
| 2020 | $3,611 | $45,710 | $16,460 | $29,250 |
| 2019 | $3,548 | $40,960 | $13,030 | $27,930 |
| 2018 | $3,476 | $40,960 | $13,030 | $27,930 |
| 2017 | $3,453 | $40,960 | $13,030 | $27,930 |
| 2016 | $2,674 | $39,800 | $13,720 | $26,080 |
| 2015 | $2,536 | $39,800 | $13,720 | $26,080 |
| 2014 | $2,536 | $39,800 | $13,720 | $26,080 |
| 2012 | -- | $38,610 | $13,720 | $24,890 |
Source: Public Records
Map
Nearby Homes
- 727 Paula St
- 1072 Pool Ave
- 417 Randler Ave
- 910 Bright Ave
- 1051 Bailey Ave
- 808 Stewville Dr
- 485 Pilot Point Unit 1-301
- 475 Pilot Point 1-300
- 465 Pilot Point 1-302
- 485 Pilot Point 1-301
- 860 Helke Rd
- 475 Pilot Point Unit 1-300
- 8375 Peters Pike
- 520 Buttercup Ave
- 626 W National Rd
- 465 Pilot Point Unit 1-302
- 1588 Middle Park Dr
- 3431 Mulberry Rd
- 246 Crest Hill Ave
- 25 Long St
- 3370 Hertlein Ln
- 3348 Hertlein Ln
- 3355 Hertlein Ln
- 1104 Hertlein Ln
- 811 Damian St
- 3353 Hertlein Ln
- 1105 Hertlein Ln
- 3343 Hertlein Ln
- 817 Damian St
- 3330 Hertlein Ln
- 721 Damian St
- 901 Damian St
- 715 Damian St
- 905 Damian St
- 802 Damian St
- 808 Damian St
- 732 Damian St
- 814 Damian St
- 709 Damian St
- 726 Damian St