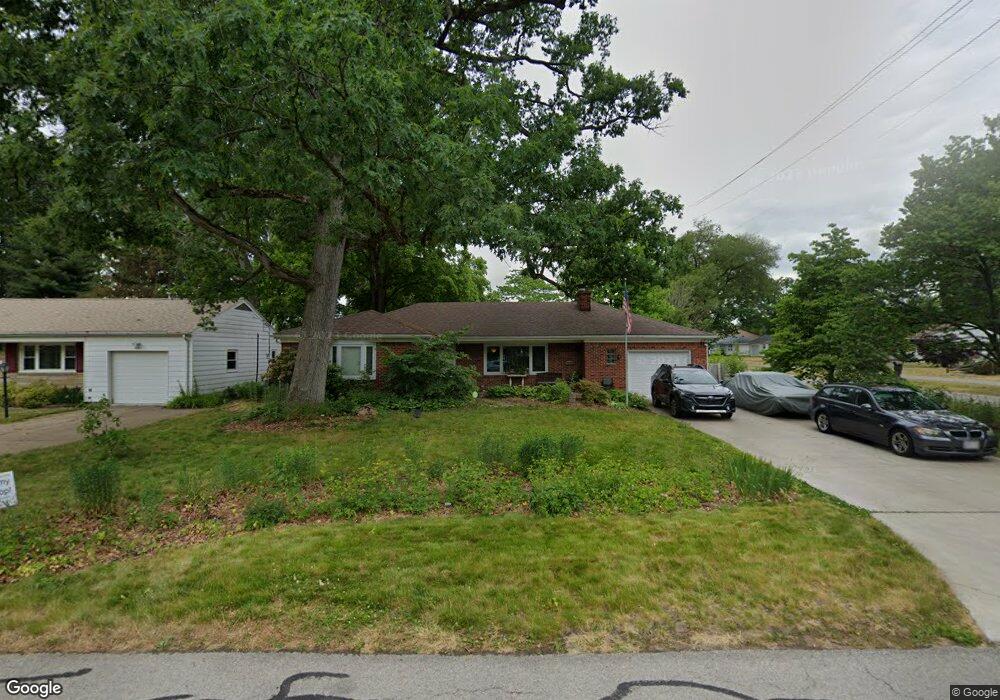
3361 Romaker Rd Toledo, OH 43615
Estimated Value: $193,000 - $216,000
3
Beds
1
Bath
1,500
Sq Ft
$137/Sq Ft
Est. Value
About This Home
This home is located at 3361 Romaker Rd, Toledo, OH 43615 and is currently estimated at $205,738, approximately $137 per square foot. 3361 Romaker Rd is a home located in Lucas County with nearby schools including Whiteford Elementary School, Sylvania Arbor Hills Junior High School, and Sylvania Southview High School.
Ownership History
Date
Name
Owned For
Owner Type
Purchase Details
Closed on
Oct 19, 1999
Sold by
Rodriguez Kim M and Ellison Kim M
Bought by
Ford Pete T and Ford Shannon M
Current Estimated Value
Home Financials for this Owner
Home Financials are based on the most recent Mortgage that was taken out on this home.
Original Mortgage
$107,650
Outstanding Balance
$32,703
Interest Rate
7.91%
Estimated Equity
$173,035
Purchase Details
Closed on
Jan 25, 1999
Sold by
Rodriguez Carlos H
Bought by
Rodriguez Kim M and Ellison Kim M
Purchase Details
Closed on
May 3, 1996
Sold by
Richards Barbara R
Bought by
Rodriguez Kim M and Rodriguez Carlos H
Home Financials for this Owner
Home Financials are based on the most recent Mortgage that was taken out on this home.
Original Mortgage
$76,500
Interest Rate
7.86%
Mortgage Type
New Conventional
Purchase Details
Closed on
Jun 22, 1993
Sold by
Smelt Charles R
Purchase Details
Closed on
Mar 2, 1989
Sold by
Sampsel Susan M
Create a Home Valuation Report for This Property
The Home Valuation Report is an in-depth analysis detailing your home's value as well as a comparison with similar homes in the area
Home Values in the Area
Average Home Value in this Area
Purchase History
| Date | Buyer | Sale Price | Title Company |
|---|---|---|---|
| Ford Pete T | $111,000 | Louisville Title Agency For | |
| Rodriguez Kim M | -- | -- | |
| Rodriguez Kim M | $85,000 | -- | |
| -- | $73,500 | -- | |
| -- | $56,000 | -- |
Source: Public Records
Mortgage History
| Date | Status | Borrower | Loan Amount |
|---|---|---|---|
| Open | Ford Pete T | $107,650 | |
| Closed | Rodriguez Kim M | $76,500 |
Source: Public Records
Tax History Compared to Growth
Tax History
| Year | Tax Paid | Tax Assessment Tax Assessment Total Assessment is a certain percentage of the fair market value that is determined by local assessors to be the total taxable value of land and additions on the property. | Land | Improvement |
|---|---|---|---|---|
| 2024 | $1,762 | $54,250 | $11,900 | $42,350 |
| 2023 | $3,628 | $47,985 | $8,750 | $39,235 |
| 2022 | $3,626 | $47,985 | $8,750 | $39,235 |
| 2021 | $3,713 | $47,985 | $8,750 | $39,235 |
| 2020 | $3,447 | $39,410 | $7,140 | $32,270 |
| 2019 | $3,321 | $39,410 | $7,140 | $32,270 |
| 2018 | $3,273 | $39,410 | $7,140 | $32,270 |
| 2017 | $3,490 | $37,765 | $6,930 | $30,835 |
| 2016 | $3,424 | $107,900 | $19,800 | $88,100 |
| 2015 | $3,230 | $107,900 | $19,800 | $88,100 |
| 2014 | $3,053 | $36,300 | $6,650 | $29,650 |
| 2013 | $3,053 | $36,300 | $6,650 | $29,650 |
Source: Public Records
Map
Nearby Homes
- 3309 Waldmar Rd
- 3207 Waldmar Rd
- 3131 Van Fleet Pkwy
- 2812 Quail Run Dr
- 3232 Moffat Rd
- 3206 Plainview Dr
- 2748 Moffat Rd
- 4025 Sherwood Forest Manor Rd
- 2523 Briarwood Ln
- 2949 Secretariat Rd
- 2537 Vaness Dr
- 3555 Hill River Dr
- 3637 Fairwood Dr
- 2515 Orchard Hills Blvd
- 5743 Candlestick Ct E
- 4921 Pine Ridge Rd
- 405 N Holland Sylvania Rd
- 2822 Page Lindsay Ln
- 4905 Pine Ridge Rd
- 4226 Corey Rd
- 3351 Romaker Rd
- 3360 Waldmar Rd
- 3347 Romaker Rd
- 3362 Waldmar Rd
- 5804 Bonsels Pkwy
- 3348 Waldmar Rd
- 5814 Bonsels Pkwy
- 3362 Romaker Rd
- 3352 Romaker Rd
- 5820 Bonsels Pkwy
- 3337 Romaker Rd
- 5764 Bonsels Pkwy
- 3342 Romaker Rd
- 5828 Bonsels Pkwy
- 5748 Bonsels Pkwy
- 3338 Waldmar Rd
- 3331 Romaker Rd
- 3336 Romaker Rd
- 3330 Waldmar Rd
- 3361 Van Fleet Pkwy