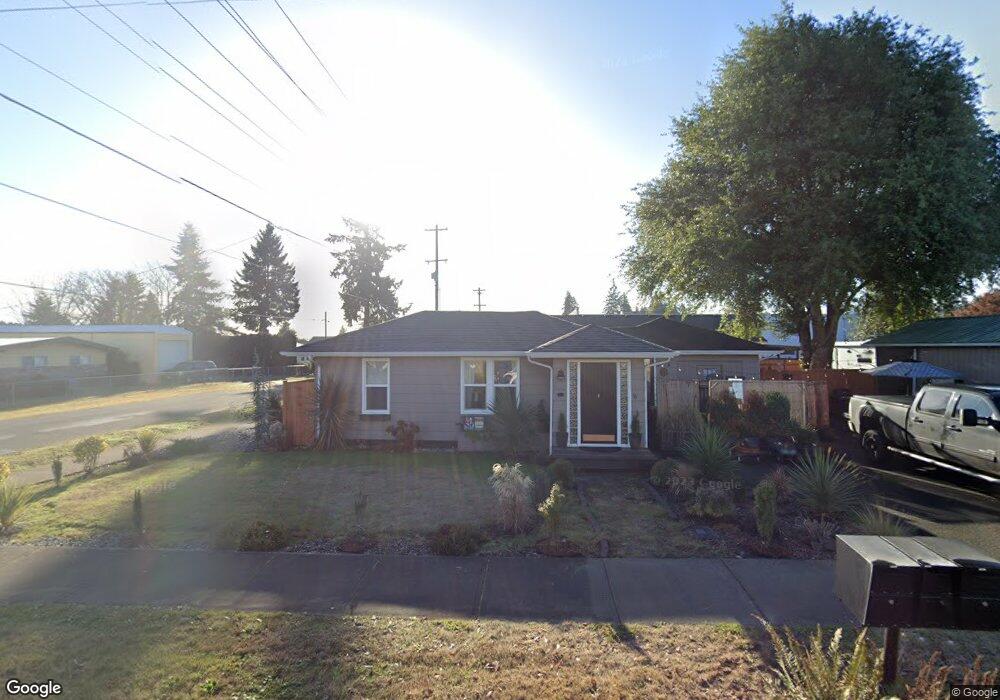
33616 SE Maple St Scappoose, OR 97056
Estimated Value: $370,626 - $422,000
2
Beds
1
Bath
1,011
Sq Ft
$382/Sq Ft
Est. Value
About This Home
This home is located at 33616 SE Maple St, Scappoose, OR 97056 and is currently estimated at $386,157, approximately $381 per square foot. 33616 SE Maple St is a home located in Columbia County with nearby schools including Scappoose High School, South Columbia Family School, and Scappoose Adventist School.
Ownership History
Date
Name
Owned For
Owner Type
Purchase Details
Closed on
Apr 5, 2018
Sold by
Apon Herbert
Bought by
Savage Joseph P
Current Estimated Value
Home Financials for this Owner
Home Financials are based on the most recent Mortgage that was taken out on this home.
Original Mortgage
$250,267
Outstanding Balance
$214,094
Interest Rate
4.4%
Mortgage Type
VA
Estimated Equity
$172,063
Purchase Details
Closed on
Jun 19, 2015
Sold by
Oliver Susan Kay
Bought by
Apon Herbert
Home Financials for this Owner
Home Financials are based on the most recent Mortgage that was taken out on this home.
Original Mortgage
$140,409
Interest Rate
3.81%
Mortgage Type
FHA
Purchase Details
Closed on
Jun 18, 2015
Sold by
Apon Rena
Bought by
Apon Herbert
Home Financials for this Owner
Home Financials are based on the most recent Mortgage that was taken out on this home.
Original Mortgage
$140,409
Interest Rate
3.81%
Mortgage Type
FHA
Create a Home Valuation Report for This Property
The Home Valuation Report is an in-depth analysis detailing your home's value as well as a comparison with similar homes in the area
Home Values in the Area
Average Home Value in this Area
Purchase History
| Date | Buyer | Sale Price | Title Company |
|---|---|---|---|
| Savage Joseph P | $245,000 | First American Title | |
| Apon Herbert | $143,000 | Ticor Title | |
| Apon Herbert | -- | Ticor Title |
Source: Public Records
Mortgage History
| Date | Status | Borrower | Loan Amount |
|---|---|---|---|
| Open | Savage Joseph P | $250,267 | |
| Previous Owner | Apon Herbert | $140,409 |
Source: Public Records
Tax History Compared to Growth
Tax History
| Year | Tax Paid | Tax Assessment Tax Assessment Total Assessment is a certain percentage of the fair market value that is determined by local assessors to be the total taxable value of land and additions on the property. | Land | Improvement |
|---|---|---|---|---|
| 2025 | $2,950 | $179,150 | $103,900 | $75,250 |
| 2024 | $2,868 | $173,940 | $100,880 | $73,060 |
| 2023 | $2,841 | $168,880 | $95,100 | $73,780 |
| 2022 | $2,722 | $163,970 | $92,330 | $71,640 |
| 2021 | $2,644 | $159,200 | $95,610 | $63,590 |
| 2020 | $2,452 | $154,570 | $88,970 | $65,600 |
| 2019 | $2,388 | $150,070 | $85,810 | $64,260 |
| 2018 | $2,333 | $145,700 | $95,960 | $49,740 |
| 2017 | $2,292 | $141,460 | $93,170 | $48,290 |
| 2016 | $2,263 | $137,340 | $90,460 | $46,880 |
| 2015 | $2,105 | $133,340 | $87,510 | $45,830 |
| 2014 | -- | $126,560 | $84,070 | $42,490 |
Source: Public Records
Map
Nearby Homes
- 51587 SE Oak St
- 51425 SE Oak St Unit 65
- 52256 SE 6th Ct
- 52171 Casswell Dr
- 51925 Columbia River Hwy
- 33375 SW Rokin Way
- 33363 SW Rokin Way
- 33358 SW Rokin Way
- 33370 SW Rokin Way
- 33344 SW Rokin Way
- 52144 SE 8th St
- 33399 NW Ej Smith Rd
- 33374 Wickstrom Dr
- 52269 SE Tyler St
- 52866 NE 2nd St
- 51692 SE 3rd St
- 52238 Teakwood Dr
- 32898 SW Keys Landing Way
- 51784 SE 9th St
- 32839 SW Crystal Springs Ct
- 33596 SE Maple St
- 52283 SE 3rd St
- 52276 SE 2nd St
- 52294 SE 3rd St
- 33621 SE Maple St
- 33601 SE Maple St
- 52320 SE 3rd St
- 33651 SE Santosh St
- 52293 SE 2nd St
- 52347 SE 3rd St
- 33664 SE Maple St
- 52295 SE 2nd St
- 52273 SE 2nd St
- 33661 SE Maple St
- 33688 SE Maple St
- 33567 SE Maple St
- 52346 SE 3rd St
- 33671 SE Santosh St
- 33602 SE Santosh St
- 52263 SE 2nd St