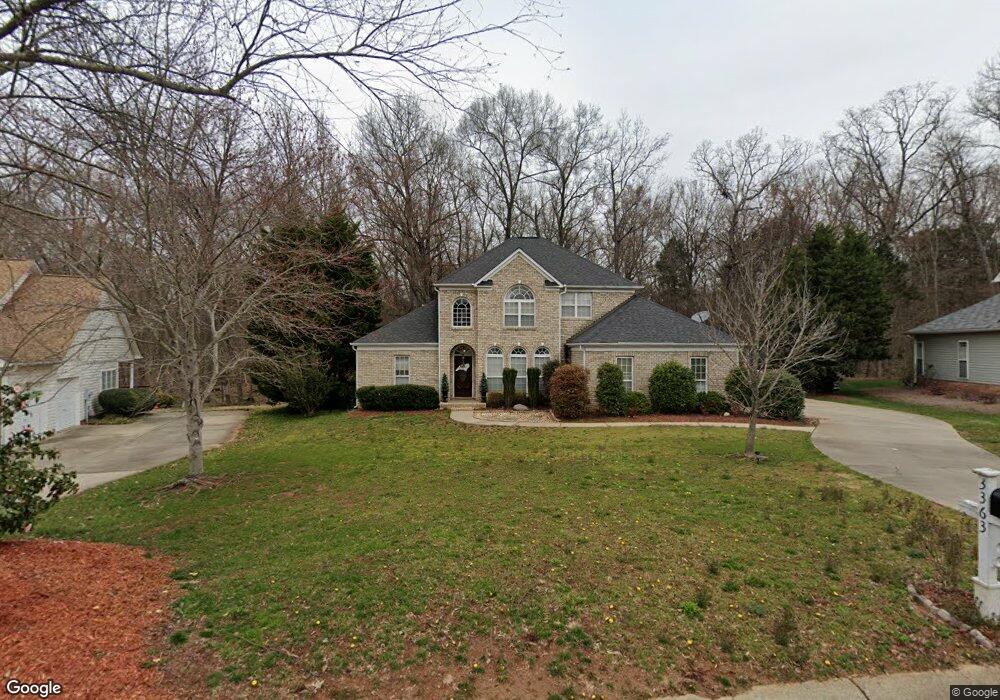
3363 Garrett Dr SW Unit 100 Concord, NC 28027
Estimated Value: $438,362 - $484,000
3
Beds
3
Baths
2,435
Sq Ft
$186/Sq Ft
Est. Value
About This Home
This home is located at 3363 Garrett Dr SW Unit 100, Concord, NC 28027 and is currently estimated at $453,591, approximately $186 per square foot. 3363 Garrett Dr SW Unit 100 is a home located in Cabarrus County with nearby schools including Wolf Meadow Elementary School, Roberta Road Middle School, and Dogwood Classical Academy.
Ownership History
Date
Name
Owned For
Owner Type
Purchase Details
Closed on
Aug 4, 2016
Sold by
Caron Mercier Joyce and Mercier Paul R
Bought by
Kettfield Matthew Brian and Kentfield Amanda Mcswain
Current Estimated Value
Home Financials for this Owner
Home Financials are based on the most recent Mortgage that was taken out on this home.
Original Mortgage
$238,000
Outstanding Balance
$194,472
Interest Rate
4.25%
Mortgage Type
Adjustable Rate Mortgage/ARM
Estimated Equity
$259,119
Purchase Details
Closed on
Aug 11, 2000
Sold by
Sharpe Joseph C and Sue Roberta
Bought by
Mercier Paul R and Caron Mercier Joyce
Home Financials for this Owner
Home Financials are based on the most recent Mortgage that was taken out on this home.
Original Mortgage
$162,400
Interest Rate
8.23%
Purchase Details
Closed on
Oct 1, 1997
Bought by
Sharpe Joseph C and Sharpe Wife
Create a Home Valuation Report for This Property
The Home Valuation Report is an in-depth analysis detailing your home's value as well as a comparison with similar homes in the area
Home Values in the Area
Average Home Value in this Area
Purchase History
| Date | Buyer | Sale Price | Title Company |
|---|---|---|---|
| Kettfield Matthew Brian | $244,000 | None Available | |
| Mercier Paul R | $203,000 | -- | |
| Sharpe Joseph C | $188,000 | -- |
Source: Public Records
Mortgage History
| Date | Status | Borrower | Loan Amount |
|---|---|---|---|
| Open | Kettfield Matthew Brian | $238,000 | |
| Previous Owner | Mercier Paul R | $162,400 | |
| Closed | Mercier Paul R | $20,300 |
Source: Public Records
Tax History Compared to Growth
Tax History
| Year | Tax Paid | Tax Assessment Tax Assessment Total Assessment is a certain percentage of the fair market value that is determined by local assessors to be the total taxable value of land and additions on the property. | Land | Improvement |
|---|---|---|---|---|
| 2025 | $4,017 | $403,280 | $70,000 | $333,280 |
| 2024 | $4,017 | $403,280 | $70,000 | $333,280 |
| 2023 | $3,345 | $274,210 | $55,000 | $219,210 |
| 2022 | $3,345 | $274,210 | $55,000 | $219,210 |
| 2021 | $3,345 | $274,210 | $55,000 | $219,210 |
| 2020 | $3,345 | $274,210 | $55,000 | $219,210 |
| 2019 | $2,775 | $227,470 | $32,000 | $195,470 |
| 2018 | $2,730 | $227,470 | $32,000 | $195,470 |
| 2017 | $2,684 | $196,810 | $32,000 | $164,810 |
| 2016 | $1,378 | $180,200 | $23,000 | $157,200 |
| 2015 | $2,126 | $180,200 | $23,000 | $157,200 |
| 2014 | $2,126 | $180,200 | $23,000 | $157,200 |
Source: Public Records
Map
Nearby Homes
- 3141 Yates Mill Dr SW
- 3807 Bent Creek Dr SW
- 3811 Bent Creek Dr SW
- 4370 Coddle Creek Dr
- 3333 Roberta Rd
- 3133 Roberta Rd
- 3369 Roberta Rd
- 3455 Roberta Rd
- 287 Halton Crossing Dr SW
- 3011 Langhorne Ave SW
- 193 Halton Crossing Dr SW
- 3913 Stough Rd
- 4349 Roberta Rd
- 4104 Pebblebrook Cir SW
- 3174 Farmwood Blvd SW Unit 154
- 2694 Woodcrest Dr SW
- 4114 Carolina Pointe Ct SW
- 4112 Alexis Ct SW
- 1398 Kent Downs Ave SW Unit 52
- 3673 Farm Lake Dr SW
- 3363 Garrett Dr SW
- 3365 Garrett Dr SW
- 3361 Garrett Dr SW
- 3358 Garrett Dr SW
- 3358 Garrett Dr SW Unit 118
- 3367 Garrett Dr SW
- 3359 Garrett Dr SW
- 3364 Garrett Dr SW
- 3354 Garrett Dr SW
- 3371 Garrett Dr SW
- 3357 Garrett Dr SW
- 3368 Garrett Dr SW
- 3319 Seven Eagles Ct SW
- 3372 Garrett Dr SW
- 3350 Garrett Dr SW
- 3353 Garrett Dr SW
- 3353 Garrett Dr SW Unit 96
- 3315 Seven Eagles Ct SW
- 3375 Garrett Dr SW
- 3318 Seven Eagles Ct SW