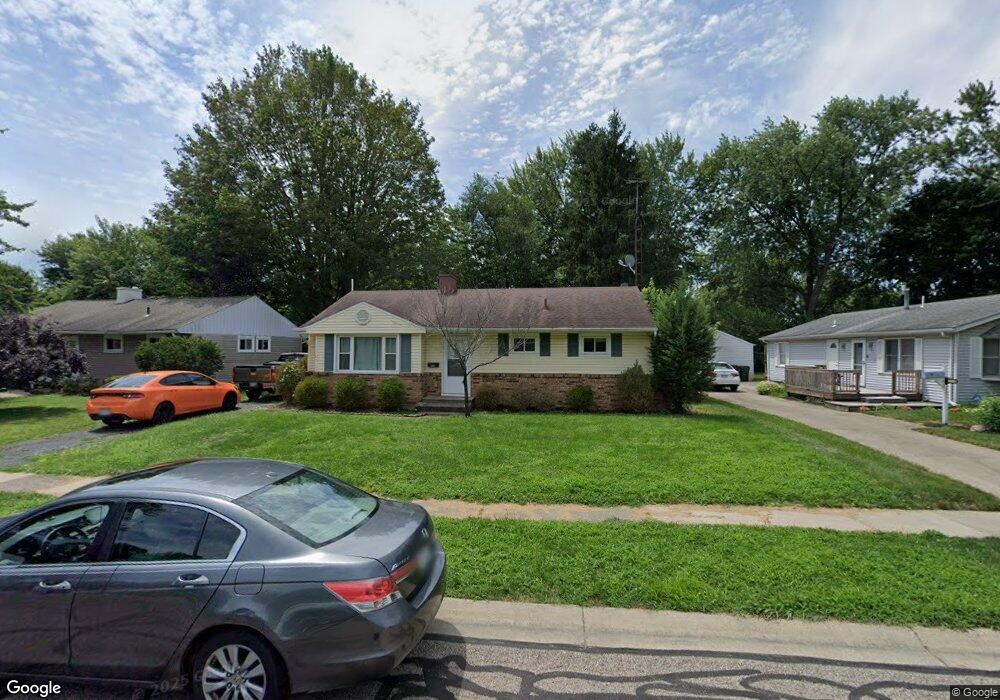
3363 Valleywood Dr Dayton, OH 45429
Estimated Value: $164,000 - $182,000
3
Beds
1
Bath
984
Sq Ft
$174/Sq Ft
Est. Value
About This Home
This home is located at 3363 Valleywood Dr, Dayton, OH 45429 and is currently estimated at $171,326, approximately $174 per square foot. 3363 Valleywood Dr is a home located in Montgomery County with nearby schools including Prass Elementary School, Kettering Middle School, and Kettering Fairmont High School.
Ownership History
Date
Name
Owned For
Owner Type
Purchase Details
Closed on
Jun 30, 2021
Sold by
Farwell Kenneth
Bought by
Black Iris and Huggard Nicolas Kent
Current Estimated Value
Purchase Details
Closed on
May 8, 2015
Sold by
Federal Home Loan Mortgage Corporation
Bought by
Farwell Kenneth
Purchase Details
Closed on
Jan 5, 2015
Sold by
Jones Casey G and Fifth Third Mortgage Co
Bought by
Federal Home Loan Mortgage Corporation
Purchase Details
Closed on
Sep 28, 2012
Sold by
Ruffing Richard and Ruffing Linda
Bought by
Jones Casey G
Purchase Details
Closed on
Jan 23, 2002
Sold by
Seale Fred D
Bought by
Ruffing Richard and Ruffing Linda
Home Financials for this Owner
Home Financials are based on the most recent Mortgage that was taken out on this home.
Original Mortgage
$48,800
Interest Rate
7.16%
Purchase Details
Closed on
Nov 23, 1992
Sold by
Seale Michelle
Bought by
Seale Fred D
Create a Home Valuation Report for This Property
The Home Valuation Report is an in-depth analysis detailing your home's value as well as a comparison with similar homes in the area
Home Values in the Area
Average Home Value in this Area
Purchase History
| Date | Buyer | Sale Price | Title Company |
|---|---|---|---|
| Black Iris | $131,400 | Chicago Title Company Llc | |
| Farwell Kenneth | -- | None Available | |
| Federal Home Loan Mortgage Corporation | $46,000 | None Available | |
| Jones Casey G | $70,000 | None Available | |
| Ruffing Richard | $61,000 | Evans Title Agency Inc | |
| Seale Fred D | -- | -- |
Source: Public Records
Mortgage History
| Date | Status | Borrower | Loan Amount |
|---|---|---|---|
| Previous Owner | Ruffing Richard | $48,800 |
Source: Public Records
Tax History Compared to Growth
Tax History
| Year | Tax Paid | Tax Assessment Tax Assessment Total Assessment is a certain percentage of the fair market value that is determined by local assessors to be the total taxable value of land and additions on the property. | Land | Improvement |
|---|---|---|---|---|
| 2024 | $2,612 | $36,980 | $9,880 | $27,100 |
| 2023 | $2,612 | $36,980 | $9,880 | $27,100 |
| 2022 | $2,552 | $28,310 | $7,540 | $20,770 |
| 2021 | $2,385 | $28,310 | $7,540 | $20,770 |
| 2020 | $2,438 | $28,310 | $7,540 | $20,770 |
| 2019 | $2,368 | $24,200 | $7,540 | $16,660 |
| 2018 | $2,379 | $24,200 | $7,540 | $16,660 |
| 2017 | $2,222 | $24,200 | $7,540 | $16,660 |
| 2016 | $2,000 | $23,520 | $7,540 | $15,980 |
| 2015 | $1,867 | $23,520 | $7,540 | $15,980 |
| 2014 | $1,867 | $23,520 | $7,540 | $15,980 |
| 2012 | -- | $24,960 | $7,500 | $17,460 |
Source: Public Records
Map
Nearby Homes
- 3525 Valleywood Dr
- 3040 Ridgemore Ave
- 3201 Beaver Ave
- 1716 Willamet Rd
- 1812 E Dorothy Ln
- 1651 Beaverton Dr
- 3700 Valleywood Dr
- 2301 Danube Ct
- 3736 Valleywood Dr
- 3428 Pobst Dr
- 2432 Danube Ct
- 2512 Olson Dr
- 3009 La Plata Dr
- 2758 Sutton Ave
- 1304 Devon Ave
- 3725 Claybourne Rd
- 2509 E Dorothy Ln
- 3309 Sharon Ave
- 3168 Cobblestone Ln Unit 103168
- 3198 Sagamon Ave Unit 13198
- 3377 Valleywood Dr
- 3349 Valleywood Dr
- 3387 Valleywood Dr
- 3335 Valleywood Dr
- 3372 Annabelle Dr
- 3362 Annabelle Dr
- 3382 Annabelle Dr
- 3362 Valleywood Dr
- 3397 Valleywood Dr
- 3352 Annabelle Dr
- 3348 Valleywood Dr
- 3376 Valleywood Dr
- 3394 Annabelle Dr
- 1854 Clarissa Ave
- 3334 Valleywood Dr
- 3382 Valleywood Dr
- 3401 Valleywood Dr
- 1850 Clarissa Ave
- 3400 Annabelle Dr
- 3320 Valleywood Dr