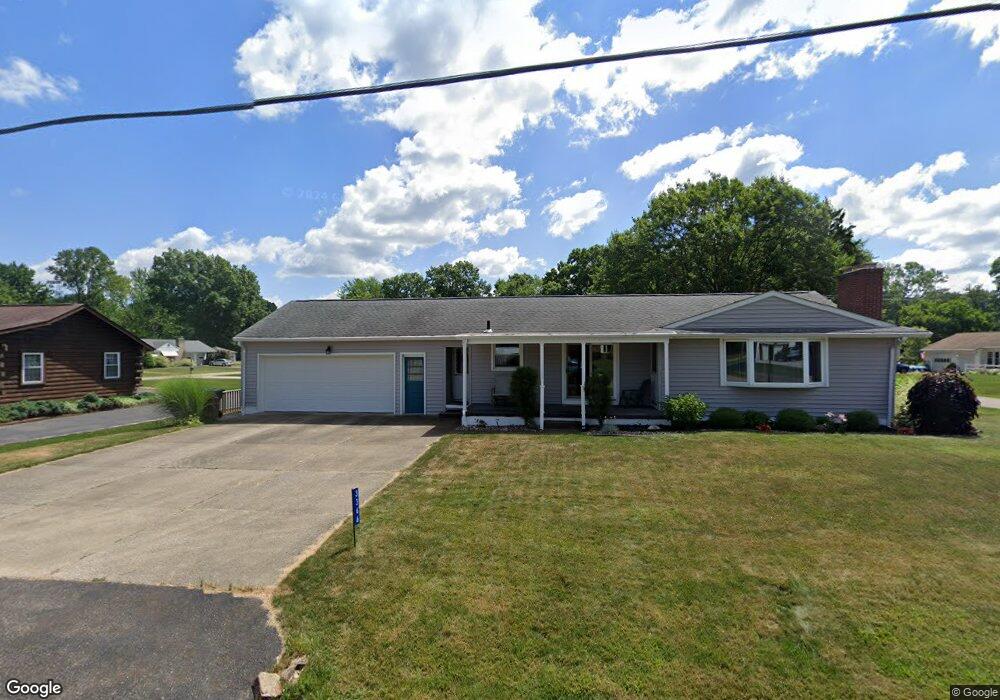
3366 Broadhaven Ave NW Massillon, OH 44646
Amherst Heights-Clearview NeighborhoodEstimated Value: $178,983 - $206,000
3
Beds
1
Bath
1,123
Sq Ft
$170/Sq Ft
Est. Value
About This Home
This home is located at 3366 Broadhaven Ave NW, Massillon, OH 44646 and is currently estimated at $190,996, approximately $170 per square foot. 3366 Broadhaven Ave NW is a home located in Stark County with nearby schools including Amherst Elementary School, Jackson Memorial Middle School, and Jackson High School.
Ownership History
Date
Name
Owned For
Owner Type
Purchase Details
Closed on
Mar 22, 2021
Sold by
Hunyadi Michael S and Hunyadi Cynthia A
Bought by
Hunyadi Cynthia A
Current Estimated Value
Home Financials for this Owner
Home Financials are based on the most recent Mortgage that was taken out on this home.
Original Mortgage
$102,000
Interest Rate
2.73%
Mortgage Type
New Conventional
Purchase Details
Closed on
May 13, 2006
Sold by
Hunyadi Michael J and Hunyadi Cynthia A
Bought by
Hunyadi Ii Michael J and Hunyadi Cynthia A
Purchase Details
Closed on
Jun 2, 1999
Sold by
Hardgrove Harold E and Hardgrove Eilene R
Bought by
Hunyadi Ii Michael J and Hunyadi Cynthia A
Home Financials for this Owner
Home Financials are based on the most recent Mortgage that was taken out on this home.
Original Mortgage
$85,000
Interest Rate
6.94%
Mortgage Type
Purchase Money Mortgage
Create a Home Valuation Report for This Property
The Home Valuation Report is an in-depth analysis detailing your home's value as well as a comparison with similar homes in the area
Home Values in the Area
Average Home Value in this Area
Purchase History
| Date | Buyer | Sale Price | Title Company |
|---|---|---|---|
| Hunyadi Cynthia A | -- | Mk Land Title Inc | |
| Hunyadi Ii Michael J | -- | None Available | |
| Hunyadi Ii Michael J | $115,000 | -- |
Source: Public Records
Mortgage History
| Date | Status | Borrower | Loan Amount |
|---|---|---|---|
| Closed | Hunyadi Cynthia A | $102,000 | |
| Closed | Hunyadi Ii Michael J | $85,000 |
Source: Public Records
Tax History Compared to Growth
Tax History
| Year | Tax Paid | Tax Assessment Tax Assessment Total Assessment is a certain percentage of the fair market value that is determined by local assessors to be the total taxable value of land and additions on the property. | Land | Improvement |
|---|---|---|---|---|
| 2025 | -- | $46,480 | $18,410 | $28,070 |
| 2024 | -- | $46,480 | $18,410 | $28,070 |
| 2023 | $2,105 | $42,280 | $12,670 | $29,610 |
| 2022 | $2,097 | $42,280 | $12,670 | $29,610 |
| 2021 | $2,105 | $42,280 | $12,670 | $29,610 |
| 2020 | $1,976 | $36,470 | $10,920 | $25,550 |
| 2019 | $1,903 | $36,470 | $10,920 | $25,550 |
| 2018 | $1,913 | $36,470 | $10,920 | $25,550 |
| 2017 | $1,910 | $34,650 | $9,240 | $25,410 |
| 2016 | $1,923 | $34,650 | $9,240 | $25,410 |
| 2015 | $1,946 | $34,650 | $9,240 | $25,410 |
| 2014 | $1,966 | $33,470 | $8,930 | $24,540 |
| 2013 | $969 | $33,470 | $8,930 | $24,540 |
Source: Public Records
Map
Nearby Homes
- 3315 Broadhaven Ave NW
- 3252 Stahl Ave NW
- 1267 Plymouth St NW
- 8445 Stuhldreher St NW
- 3410 Wales Ave NW
- 8625 Milmont St NW
- 7604 Greenview Ave NW
- 1204 Taggart St NW
- 1056 Taggart St NW
- 710 Leecrest St NW
- 2866 Carie Hill Cir NW
- 8484 Traphagen St NW
- 3715 Riviera Ave NW
- 0 Wildridge Rd NW Unit 36853475
- 3536 Oxford Ave NW
- 1026 Beverly Rd NE
- 7978 Parkford St NW
- 0 Cambridge St NW
- 1850 Amherst Rd NE
- 7770 Hills And Dales Rd NW
- 3380 Broadhaven Ave NW
- 8319 Roush St NW
- 3344 Broadhaven Ave NW
- 3359 Broadhaven Ave NW
- 3383 Broadhaven Ave NW
- 8300 Milmont St NW
- 8300 Milmont St NW
- 8324 Roush St NW
- 3341 Broadhaven Ave NW
- 3414 Broadhaven Ave NW
- 8290 Milmont St NW
- 3316 Broadhaven Ave NW
- 8304 Roush St NW
- 8313 Milmont St NW
- 8283 Roush St NW
- 8272 Milmont St NW
- 3415 Broadhaven Ave NW
- 8295 Milmont St NW
- 8313 Caroline St NW
- 8286 Roush St NW