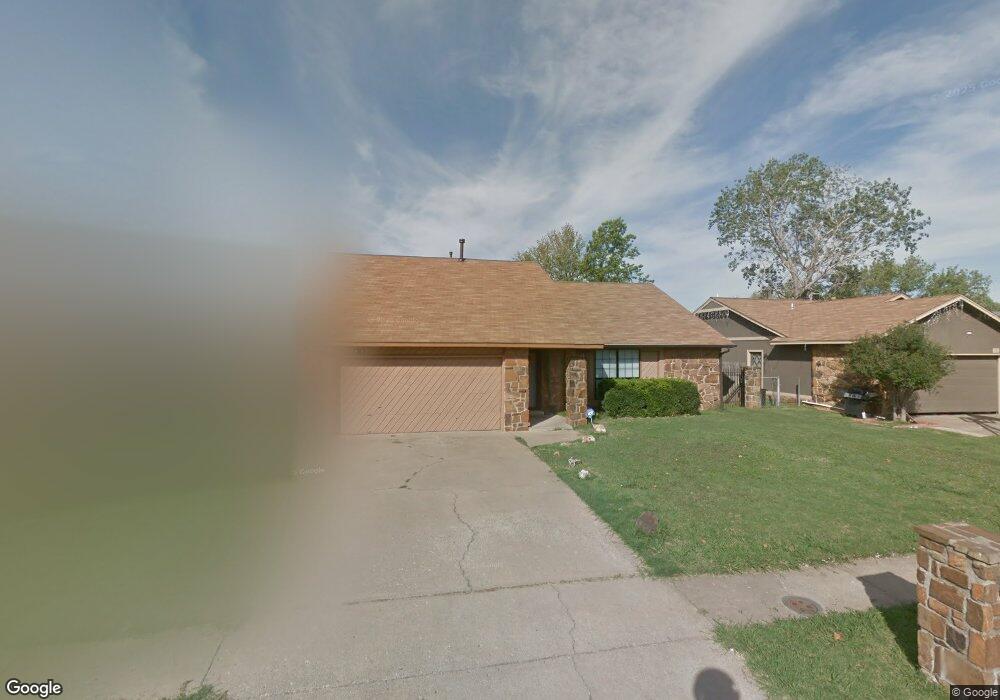
3366 S 139th East Ave Tulsa, OK 74134
Park Plaza East NeighborhoodEstimated Value: $175,000 - $215,000
3
Beds
2
Baths
1,538
Sq Ft
$126/Sq Ft
Est. Value
About This Home
This home is located at 3366 S 139th East Ave, Tulsa, OK 74134 and is currently estimated at $193,753, approximately $125 per square foot. 3366 S 139th East Ave is a home located in Tulsa County with nearby schools including Boevers Elementary School, Union 8th Grade Center, and Union 6th-7th Grade Center.
Ownership History
Date
Name
Owned For
Owner Type
Purchase Details
Closed on
Aug 23, 2024
Sold by
Moreno Angelica and Moreno Alex
Bought by
Consuelo Llc-Series 3366
Current Estimated Value
Purchase Details
Closed on
Jan 12, 2023
Sold by
Moreno Rosa C
Bought by
Moreno Angelica and Moreno Alex
Purchase Details
Closed on
May 27, 2010
Sold by
Federal National Mortgage Association
Bought by
Gomez Rosa C Munoz
Home Financials for this Owner
Home Financials are based on the most recent Mortgage that was taken out on this home.
Original Mortgage
$82,650
Interest Rate
5%
Mortgage Type
New Conventional
Purchase Details
Closed on
Jan 13, 2010
Sold by
Lewallen Carol
Bought by
Federal National Mortgage Association
Purchase Details
Closed on
Sep 1, 1980
Create a Home Valuation Report for This Property
The Home Valuation Report is an in-depth analysis detailing your home's value as well as a comparison with similar homes in the area
Home Values in the Area
Average Home Value in this Area
Purchase History
| Date | Buyer | Sale Price | Title Company |
|---|---|---|---|
| Consuelo Llc-Series 3366 | -- | None Listed On Document | |
| Moreno Angelica | $125,000 | Community Title Services | |
| Gomez Rosa C Munoz | $87,000 | Firstitle & Abstract Service | |
| Federal National Mortgage Association | -- | None Available | |
| -- | $9,000 | -- |
Source: Public Records
Mortgage History
| Date | Status | Borrower | Loan Amount |
|---|---|---|---|
| Previous Owner | Gomez Rosa C Munoz | $82,650 |
Source: Public Records
Tax History Compared to Growth
Tax History
| Year | Tax Paid | Tax Assessment Tax Assessment Total Assessment is a certain percentage of the fair market value that is determined by local assessors to be the total taxable value of land and additions on the property. | Land | Improvement |
|---|---|---|---|---|
| 2024 | $1,958 | $19,211 | $2,970 | $16,241 |
| 2023 | $1,958 | $15,316 | $2,339 | $12,977 |
| 2022 | $1,943 | $14,586 | $2,742 | $11,844 |
| 2021 | $1,875 | $13,892 | $2,612 | $11,280 |
| 2020 | $1,760 | $13,230 | $2,750 | $10,480 |
| 2019 | $1,770 | $12,861 | $2,673 | $10,188 |
| 2018 | $1,682 | $12,249 | $2,546 | $9,703 |
| 2017 | $1,612 | $11,666 | $2,425 | $9,241 |
| 2016 | $1,501 | $11,110 | $2,750 | $8,360 |
| 2015 | $1,517 | $11,110 | $2,750 | $8,360 |
| 2014 | $1,493 | $11,110 | $2,750 | $8,360 |
Source: Public Records
Map
Nearby Homes
- 3352 S 138th East Ave
- 3363 S 137th East Ave
- 13801 E 33rd Place
- 3352 S 143rd East Ave
- 13321 E 33rd Place
- 3320 S 144th East Ave
- 14719 E 39th St S
- 3907 S 150th East Ave
- 14841 E 32nd St S
- 13226 E 37th St
- 13508 E 31st Place
- 3025 S 136th East Ave Unit 3025
- 12939 E 34th St
- 3017 S 136th East Ave Unit A
- 4010 S 133rd East Ave
- 14618 E 39th St S
- 3544 S 150th East Ave
- 15002 E 35th Place
- 12636 E 34th St
- 12802 E 31st Ct
- 3362 S 139th East Ave
- 13819 E 36th St
- 3365 S 138th East Ave
- 3358 S 139th East Ave
- 3361 S 138th East Ave
- 13809 E 36th St
- 3365 S 139th East Ave
- 3355 S 138th East Ave
- 3361 S 139th Ave E
- 3352 S 139th Ave E
- 3352 S 139th Ave E Unit Avenue
- 3361 S 139th East Ave
- 3352 S 139th East Ave
- 13909 E 36th St
- 3357 S 139th East Ave
- 3351 S 138th East Ave
- 3348 S 139th East Ave
- 13820 E 36th St
- 3353 S 139th East Ave
- 13904 E 36th St