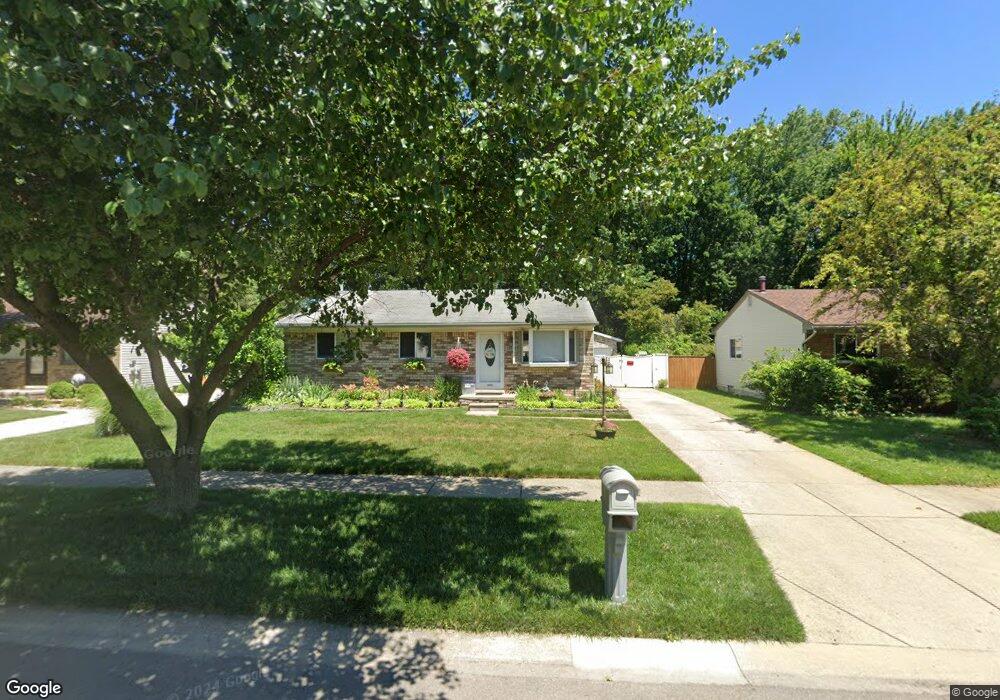
33668 Union Ct Westland, MI 48186
Estimated Value: $240,000 - $291,000
3
Beds
2
Baths
1,098
Sq Ft
$233/Sq Ft
Est. Value
About This Home
This home is located at 33668 Union Ct, Westland, MI 48186 and is currently estimated at $256,235, approximately $233 per square foot. 33668 Union Ct is a home located in Wayne County with nearby schools including Alexander Hamilton Elementary School, Marshall Upper Elementary School, and John Glenn High School.
Ownership History
Date
Name
Owned For
Owner Type
Purchase Details
Closed on
Sep 21, 2017
Sold by
Medina Lopez Juan Carols and Medina Luz Maria
Bought by
Napier Tyler
Current Estimated Value
Home Financials for this Owner
Home Financials are based on the most recent Mortgage that was taken out on this home.
Original Mortgage
$127,645
Outstanding Balance
$107,910
Interest Rate
4.37%
Mortgage Type
FHA
Estimated Equity
$148,325
Purchase Details
Closed on
Jan 31, 2012
Sold by
Napier Brian
Bought by
Napier Brian and Napier Jackqueline R
Purchase Details
Closed on
Mar 30, 2009
Sold by
Morgan Aaron and Morgan Kimberlee M
Bought by
Napier Brian
Purchase Details
Closed on
Oct 29, 2008
Sold by
Morgan Aaron and Morgan Kimberlee M
Bought by
Wells Fargo Bank Na
Purchase Details
Closed on
Sep 28, 2005
Sold by
Brokenshire William D and Brokenshire Lori A
Bought by
Morgan Aaron
Purchase Details
Closed on
Nov 30, 1995
Sold by
Broke William D and Broke Lori A
Bought by
Brokenshire William D and Brokenshire Lori A
Create a Home Valuation Report for This Property
The Home Valuation Report is an in-depth analysis detailing your home's value as well as a comparison with similar homes in the area
Home Values in the Area
Average Home Value in this Area
Purchase History
| Date | Buyer | Sale Price | Title Company |
|---|---|---|---|
| Napier Tyler | $130,000 | Title One Inc | |
| Napier Brian | -- | None Available | |
| Napier Brian | $95,000 | Multiple | |
| Wells Fargo Bank Na | $178,783 | None Available | |
| Morgan Aaron | $168,000 | Great Lakes Title Of Mi | |
| Brokenshire William D | $109,400 | -- |
Source: Public Records
Mortgage History
| Date | Status | Borrower | Loan Amount |
|---|---|---|---|
| Open | Napier Tyler | $127,645 |
Source: Public Records
Tax History Compared to Growth
Tax History
| Year | Tax Paid | Tax Assessment Tax Assessment Total Assessment is a certain percentage of the fair market value that is determined by local assessors to be the total taxable value of land and additions on the property. | Land | Improvement |
|---|---|---|---|---|
| 2025 | $2,295 | $114,200 | $0 | $0 |
| 2024 | $2,295 | $113,800 | $0 | $0 |
| 2023 | $2,191 | $103,300 | $0 | $0 |
| 2022 | $2,487 | $92,900 | $0 | $0 |
| 2021 | $3,006 | $86,700 | $0 | $0 |
| 2020 | $3,286 | $77,700 | $0 | $0 |
| 2019 | $3,914 | $68,400 | $0 | $0 |
| 2018 | $2,205 | $61,900 | $0 | $0 |
| 2017 | $2,033 | $59,700 | $0 | $0 |
| 2016 | $2,461 | $53,600 | $0 | $0 |
| 2015 | $4,462 | $46,590 | $0 | $0 |
| 2013 | $4,323 | $45,160 | $0 | $0 |
| 2012 | $2,405 | $45,500 | $0 | $0 |
Source: Public Records
Map
Nearby Homes
- 711 S Hawthorne St
- 754 Alvin St
- 34114 Avondale St
- 451 Darwin St
- 366 S Wildwood St
- 1163 Denice St
- 00000 Cherry Hill Rd
- 183 Daniel Ave Unit 6
- 232 S Wildwood St
- 33532 Leona St
- 284 S Byfield St
- 34728 Somerset St
- 357 S Dobson St
- 32732 Glen St
- 360 van Sull St
- 34553 Hazelwood St
- 0000 Barrington Ave
- 344 S Christine
- 1631 Ackley Ave
- 34610 School St
- 33654 Union Ct
- 33682 Union Ct
- 0 Union Ct
- 33696 Union Ct
- 33640 Union Ct
- 33667 Union Ct
- 33695 Union Ct
- 33653 Union Ct
- 33639 Union Ct
- 33612 Union Ct
- 33710 Union Ct
- 33724 Union Ct
- 33626 Union Ct
- 33635 Hiveley St
- 33625 Union Ct
- 33723 Union Ct
- 33659 Hiveley St
- 33611 Union Ct
- 33645 Hiveley St
- 614 S Schuman St