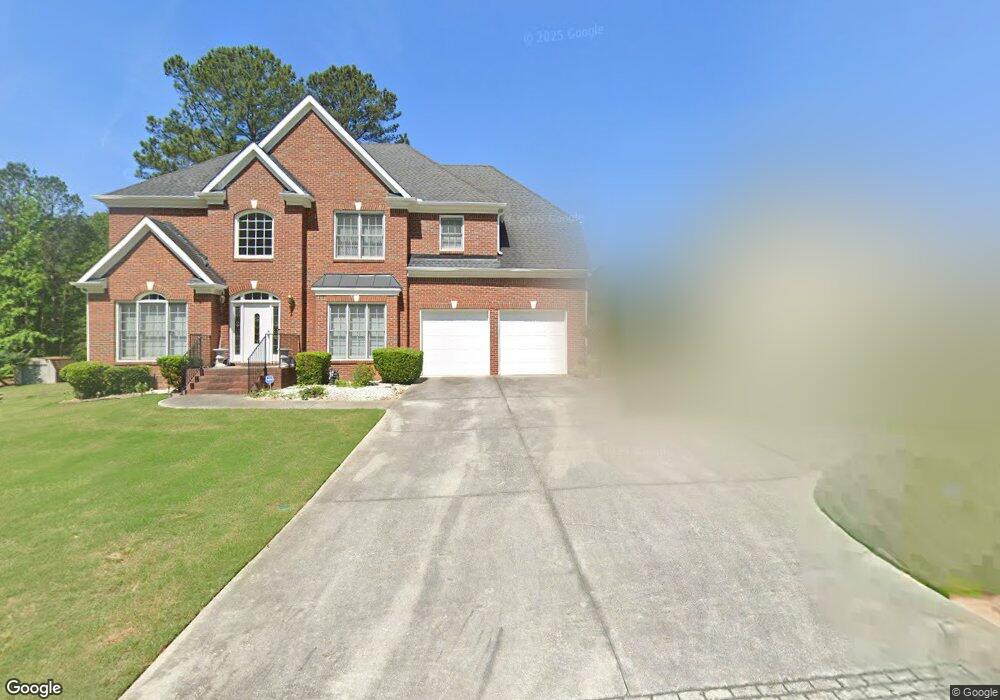
3367 Spring Lake Overlook Lithonia, GA 30038
Estimated Value: $341,000 - $423,000
4
Beds
3
Baths
2,558
Sq Ft
$146/Sq Ft
Est. Value
About This Home
This home is located at 3367 Spring Lake Overlook, Lithonia, GA 30038 and is currently estimated at $374,453, approximately $146 per square foot. 3367 Spring Lake Overlook is a home located in DeKalb County with nearby schools including Flat Rock Elementary School, Lithonia Middle School, and Lithonia High School.
Ownership History
Date
Name
Owned For
Owner Type
Purchase Details
Closed on
Jun 30, 2005
Sold by
Forbes Cassandra
Bought by
Brown Gladys
Current Estimated Value
Home Financials for this Owner
Home Financials are based on the most recent Mortgage that was taken out on this home.
Original Mortgage
$179,900
Outstanding Balance
$93,131
Interest Rate
5.63%
Mortgage Type
New Conventional
Estimated Equity
$281,322
Purchase Details
Closed on
Aug 7, 2001
Sold by
Thompson Bridgett
Bought by
Shipman Cassandra P
Home Financials for this Owner
Home Financials are based on the most recent Mortgage that was taken out on this home.
Original Mortgage
$229,300
Interest Rate
7.5%
Mortgage Type
New Conventional
Purchase Details
Closed on
Dec 29, 2000
Sold by
Harper Phillip D and Harper Annie C
Bought by
Thompson Bridget
Home Financials for this Owner
Home Financials are based on the most recent Mortgage that was taken out on this home.
Original Mortgage
$216,900
Interest Rate
7.75%
Mortgage Type
New Conventional
Create a Home Valuation Report for This Property
The Home Valuation Report is an in-depth analysis detailing your home's value as well as a comparison with similar homes in the area
Home Values in the Area
Average Home Value in this Area
Purchase History
| Date | Buyer | Sale Price | Title Company |
|---|---|---|---|
| Brown Gladys | $257,000 | -- | |
| Shipman Cassandra P | $241,400 | -- | |
| Thompson Bridget | $216,900 | -- |
Source: Public Records
Mortgage History
| Date | Status | Borrower | Loan Amount |
|---|---|---|---|
| Open | Brown Gladys | $179,900 | |
| Previous Owner | Shipman Cassandra P | $229,300 | |
| Previous Owner | Thompson Bridget | $216,900 |
Source: Public Records
Tax History Compared to Growth
Tax History
| Year | Tax Paid | Tax Assessment Tax Assessment Total Assessment is a certain percentage of the fair market value that is determined by local assessors to be the total taxable value of land and additions on the property. | Land | Improvement |
|---|---|---|---|---|
| 2025 | $1,010 | $141,600 | $28,320 | $113,280 |
| 2024 | $1,120 | $141,600 | $28,520 | $113,080 |
| 2023 | $1,120 | $139,560 | $28,520 | $111,040 |
| 2022 | $1,043 | $113,840 | $28,520 | $85,320 |
| 2021 | $958 | $92,800 | $28,520 | $64,280 |
| 2020 | $933 | $93,560 | $28,520 | $65,040 |
| 2019 | $950 | $91,920 | $28,520 | $63,400 |
| 2018 | $877 | $86,640 | $28,520 | $58,120 |
| 2017 | $928 | $82,200 | $28,520 | $53,680 |
| 2016 | $917 | $87,640 | $28,520 | $59,120 |
| 2014 | $920 | $96,640 | $28,440 | $68,200 |
Source: Public Records
Map
Nearby Homes
- 6061 Spring Way
- 5985 Spring Way
- 6055 Spring Way
- Lakewood Plan at Highland Park
- Swindon Plan at Highland Park
- Brookpark Plan at Highland Park
- Heron Cottage Plan at Highland Park
- Easton Plan at Highland Park
- Mallow Plan at Highland Park
- Inwood Plan at Highland Park
- Colehill Plan at Highland Park
- Lancaster Plan at Highland Park
- 3003 Fairing Hill
- 6093 Ruby Falls
- 2966 Fairton Trail
- 5964 Springfair Run
- 3555 Wade Rd
- 3237 Fairington Dr
- 6400 Rockland Rd
- 3219 Fairington Dr
- 3375 Spring Lake Overlook
- 3357 Spring Lake Overlook
- 3345 Spring Lake Overlook
- 6148 Lakeview Overlook
- 3370 Spring Lake Overlook
- 0 Spring Lake Overlook Unit 9041854
- 3337 Spring Lake Overlook
- 6138 Lakeview Overlook
- 3360 Spring Lake Overlook
- 3382 Spring Lake Overlook
- 3329 Spring Lake Overlook
- 6165 Lakeside Cir
- 3350 Spring Lake Overlook
- 3394 Spring Lake Overlook
- 6126 Lakeview Overlook
- 6145 Lakeview Overlook
- 3340 Spring Lake Overlook
- 3323 Spring Lake Overlook
- 6173 Lakeside Cir
- 3330 Spring Lake Overlook