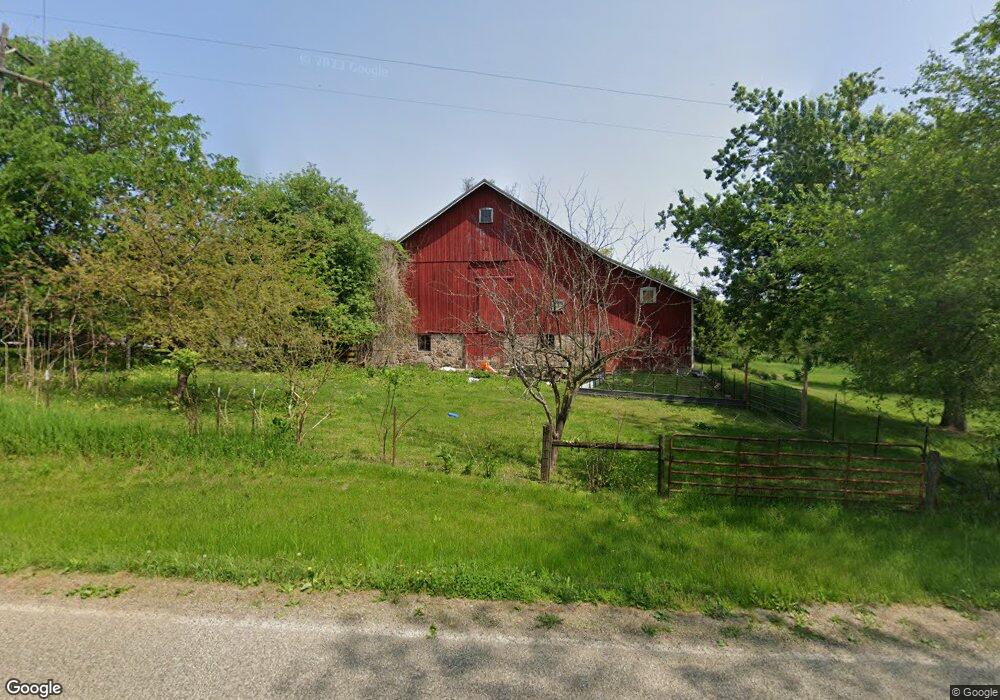
33670 Fawn River Rd Burr Oak, MI 49030
Estimated Value: $342,699 - $482,000
5
Beds
4
Baths
3,616
Sq Ft
$112/Sq Ft
Est. Value
About This Home
This home is located at 33670 Fawn River Rd, Burr Oak, MI 49030 and is currently estimated at $405,175, approximately $112 per square foot. 33670 Fawn River Rd is a home located in St. Joseph County with nearby schools including Sturgis High School.
Ownership History
Date
Name
Owned For
Owner Type
Purchase Details
Closed on
Nov 13, 2009
Sold by
Ogg Robert V and Ogg Stacie L
Bought by
Park Sang Jin and Arseneau Carie E
Current Estimated Value
Home Financials for this Owner
Home Financials are based on the most recent Mortgage that was taken out on this home.
Original Mortgage
$125,000
Outstanding Balance
$81,453
Interest Rate
4.96%
Mortgage Type
New Conventional
Estimated Equity
$323,722
Purchase Details
Closed on
Aug 19, 2005
Sold by
Ogg Robert V and Ogg Stacie L
Bought by
Crook Scott Richard
Home Financials for this Owner
Home Financials are based on the most recent Mortgage that was taken out on this home.
Original Mortgage
$65,700
Interest Rate
5.8%
Mortgage Type
Balloon
Purchase Details
Closed on
Jan 10, 2003
Sold by
Petruska John J and Petruska Kay E
Bought by
Ogg Robert and Ogg Stacie L
Purchase Details
Closed on
Jun 11, 1997
Sold by
Petruska John J
Bought by
Petruska John J and Petruska Kay E
Purchase Details
Closed on
Sep 1, 1989
Sold by
Brooks Bonnie L
Bought by
Petruska John J
Create a Home Valuation Report for This Property
The Home Valuation Report is an in-depth analysis detailing your home's value as well as a comparison with similar homes in the area
Home Values in the Area
Average Home Value in this Area
Purchase History
| Date | Buyer | Sale Price | Title Company |
|---|---|---|---|
| Park Sang Jin | $205,000 | Patrick Abstract | |
| Crook Scott Richard | $73,000 | -- | |
| Ogg Robert | $235,000 | -- | |
| Petruska John J | -- | -- | |
| Petruska John J | $25,000 | -- |
Source: Public Records
Mortgage History
| Date | Status | Borrower | Loan Amount |
|---|---|---|---|
| Open | Park Sang Jin | $125,000 | |
| Previous Owner | Crook Scott Richard | $65,700 |
Source: Public Records
Tax History Compared to Growth
Tax History
| Year | Tax Paid | Tax Assessment Tax Assessment Total Assessment is a certain percentage of the fair market value that is determined by local assessors to be the total taxable value of land and additions on the property. | Land | Improvement |
|---|---|---|---|---|
| 2025 | $3,302 | $177,400 | $16,400 | $161,000 |
| 2024 | $1,076 | $172,000 | $17,200 | $154,800 |
| 2023 | $1,025 | $155,300 | $10,400 | $144,900 |
| 2022 | $976 | $123,800 | $9,700 | $114,100 |
| 2021 | $2,729 | $119,400 | $9,700 | $109,700 |
| 2020 | $1,761 | $121,500 | $9,700 | $111,800 |
| 2019 | $2,645 | $114,000 | $11,000 | $103,000 |
| 2018 | $2,329 | $103,900 | $11,000 | $92,900 |
| 2017 | $2,342 | $102,700 | $102,700 | $0 |
| 2016 | -- | $91,700 | $91,700 | $0 |
| 2015 | -- | $85,300 | $0 | $0 |
| 2014 | -- | $90,400 | $90,400 | $0 |
| 2012 | -- | $82,500 | $82,500 | $0 |
Source: Public Records
Map
Nearby Homes
- V Lot Fawn River Rd
- 31301 E Lafayette Rd
- 812 George Rd
- VL County Farm Rd
- 68433 Sweet Lake Rd
- 1232 Smoker Rd
- 406 Taggart Rd
- 832 W Front St
- 427 E Main St
- 6950 N 315 E
- 3145 E 695 N
- 29050 Wilderness Trail
- 229 Burr Oak Rd
- 8415 Indiana 120
- 1052 Carpenter Rd
- 69617 Eisenhower Rd
- 69548 Eisenhower Rd
- 1009 W Chicago Rd
- 1387 Flanders St
- 1218 Constitution Ave
- 69310 Workman Rd
- 33661 Fawn River Rd
- 33601 Silvercreek Rd
- 33858 Fawn River Rd
- 70635 Halsey Square Rd
- 70315 Halsey Square Rd
- 70635 Halsey Square Rd
- 33232 Fawn River Rd
- 69726 Watt Rd
- 883 Saint Joseph Rd
- 881 Saint Joseph Rd
- 33432 Silvercreek Rd
- 893 Saint Joseph Rd
- 69410 Saint Joseph Rd
- 899 Saint Joseph Rd
- 897 Saint Joseph Rd
- 847 Saint Joseph Rd
- 69830 Watt Rd
- 1268 Martin Jay Dr
- 70053 Watt Rd