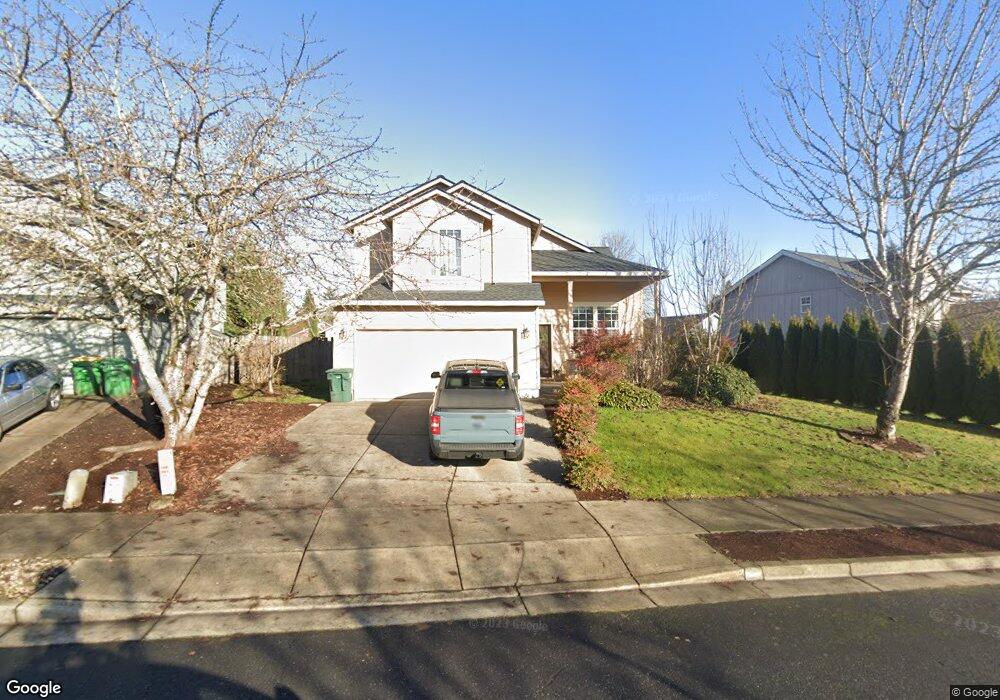
33671 SE Ray Rd Scappoose, OR 97056
Estimated Value: $497,000 - $511,000
4
Beds
3
Baths
1,883
Sq Ft
$268/Sq Ft
Est. Value
About This Home
This home is located at 33671 SE Ray Rd, Scappoose, OR 97056 and is currently estimated at $504,381, approximately $267 per square foot. 33671 SE Ray Rd is a home located in Columbia County with nearby schools including Scappoose High School, South Columbia Family School, and Scappoose Adventist School.
Ownership History
Date
Name
Owned For
Owner Type
Purchase Details
Closed on
Jul 1, 2018
Sold by
Caffall Richard S and Caffall Tamera L
Bought by
Hatfield James Clifford Edward and Hatfield Amanda Marie
Current Estimated Value
Home Financials for this Owner
Home Financials are based on the most recent Mortgage that was taken out on this home.
Original Mortgage
$321,077
Outstanding Balance
$281,649
Interest Rate
5.25%
Mortgage Type
FHA
Estimated Equity
$222,732
Purchase Details
Closed on
Sep 26, 2007
Sold by
Caffall Construction Co Inc
Bought by
Caffall Richard S and Caffall Tamera L
Home Financials for this Owner
Home Financials are based on the most recent Mortgage that was taken out on this home.
Original Mortgage
$205,000
Interest Rate
6.62%
Mortgage Type
Unknown
Create a Home Valuation Report for This Property
The Home Valuation Report is an in-depth analysis detailing your home's value as well as a comparison with similar homes in the area
Home Values in the Area
Average Home Value in this Area
Purchase History
| Date | Buyer | Sale Price | Title Company |
|---|---|---|---|
| Hatfield James Clifford Edward | $327,000 | Ticor Title | |
| Caffall Richard S | -- | Ticor Title |
Source: Public Records
Mortgage History
| Date | Status | Borrower | Loan Amount |
|---|---|---|---|
| Open | Hatfield James Clifford Edward | $321,077 | |
| Previous Owner | Caffall Richard S | $205,000 |
Source: Public Records
Tax History Compared to Growth
Tax History
| Year | Tax Paid | Tax Assessment Tax Assessment Total Assessment is a certain percentage of the fair market value that is determined by local assessors to be the total taxable value of land and additions on the property. | Land | Improvement |
|---|---|---|---|---|
| 2025 | $4,186 | $254,260 | $83,110 | $171,150 |
| 2024 | $4,070 | $246,860 | $80,690 | $166,170 |
| 2023 | $4,032 | $239,670 | $84,350 | $155,320 |
| 2022 | $3,862 | $232,690 | $81,900 | $150,790 |
| 2021 | $3,752 | $225,920 | $83,910 | $142,010 |
| 2020 | $3,480 | $219,340 | $82,860 | $136,480 |
| 2019 | $3,389 | $212,960 | $79,680 | $133,280 |
| 2018 | $3,311 | $206,760 | $81,550 | $125,210 |
| 2017 | $3,252 | $200,740 | $79,180 | $121,560 |
| 2016 | $3,211 | $194,900 | $76,870 | $118,030 |
| 2015 | $3,048 | $189,230 | $65,040 | $124,190 |
| 2014 | $2,971 | $183,720 | $56,820 | $126,900 |
Source: Public Records
Map
Nearby Homes
- 52171 Casswell Dr
- 52256 SE 6th Ct
- 51925 Columbia River Hwy
- 51587 SE Oak St
- 51425 SE Oak St Unit 65
- 52144 SE 8th St
- 33375 SW Rokin Way
- 33363 SW Rokin Way
- 33370 SW Rokin Way
- 33358 SW Rokin Way
- 33344 SW Rokin Way
- 51692 SE 3rd St
- 52269 SE Tyler St
- 52238 Teakwood Dr
- 51784 SE 9th St
- 51540 SE Westlake Dr Unit 56
- 33399 NW Ej Smith Rd
- 33374 Wickstrom Dr
- 51459 SE Westlake Dr Unit 102
- 52866 NE 2nd St
- 33683 SE Ray Rd
- 33657 SE Ray Rd
- 33670 SE Pickle Place
- 33693 SE Ray Rd
- 33660 SE Pickle Place
- 33680 SE Pickle Place
- 33682 SE Ray Rd
- 33674 SE Ray Rd
- 33664 SE Ray Rd
- 33690 SE Pickle Place
- 33692 SE Ray Rd
- 33654 SE Ray Rd
- 33611 SE Steinfeld St
- 52140 SE Sauer Ct
- 52148 SE Sauer Ct
- 33622 SE Dill Place
- 33601 SE Steinfeld St
- 33681 SE Pickle Place
- 33691 SE Pickle Place
- 33671 SE Pickle Place