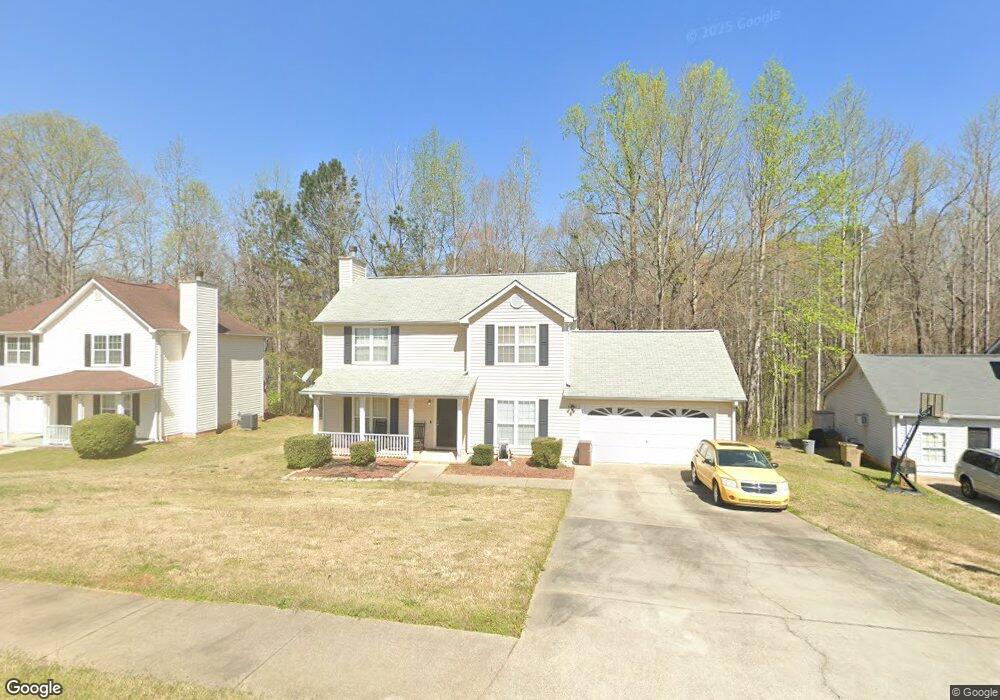
3368 Brookside Ln Jonesboro, GA 30236
Estimated Value: $224,000 - $248,000
3
Beds
3
Baths
1,476
Sq Ft
$161/Sq Ft
Est. Value
About This Home
This home is located at 3368 Brookside Ln, Jonesboro, GA 30236 and is currently estimated at $237,647, approximately $161 per square foot. 3368 Brookside Ln is a home located in Clayton County with nearby schools including Mt. Zion Primary School, Mount Zion Elementary School, and Rex Mill Middle School.
Ownership History
Date
Name
Owned For
Owner Type
Purchase Details
Closed on
Oct 29, 2024
Sold by
Sheppard Barbara
Bought by
Stevenson Cynthia
Current Estimated Value
Purchase Details
Closed on
Sep 26, 2023
Sold by
Arnold Angela H
Bought by
Arnold Rodriquiz and Bridges Latisha
Purchase Details
Closed on
Sep 17, 2012
Sold by
Arnold Rodriquiz D
Bought by
Arnold Angela H
Purchase Details
Closed on
Sep 26, 2001
Sold by
Lewis Darien
Bought by
Arnold Rodriquiz
Home Financials for this Owner
Home Financials are based on the most recent Mortgage that was taken out on this home.
Original Mortgage
$117,161
Interest Rate
6.89%
Mortgage Type
FHA
Purchase Details
Closed on
Jun 22, 1998
Sold by
Knight Group
Bought by
Lewis Darien
Home Financials for this Owner
Home Financials are based on the most recent Mortgage that was taken out on this home.
Original Mortgage
$89,205
Interest Rate
7.1%
Mortgage Type
New Conventional
Create a Home Valuation Report for This Property
The Home Valuation Report is an in-depth analysis detailing your home's value as well as a comparison with similar homes in the area
Home Values in the Area
Average Home Value in this Area
Purchase History
| Date | Buyer | Sale Price | Title Company |
|---|---|---|---|
| Stevenson Cynthia | -- | -- | |
| Arnold Rodriquiz | -- | -- | |
| Arnold Angela H | -- | -- | |
| Arnold Rodriquiz | $119,000 | -- | |
| Lewis Darien | $93,900 | -- |
Source: Public Records
Mortgage History
| Date | Status | Borrower | Loan Amount |
|---|---|---|---|
| Previous Owner | Arnold Rodriquiz | $117,161 | |
| Previous Owner | Lewis Darien | $89,205 |
Source: Public Records
Tax History Compared to Growth
Tax History
| Year | Tax Paid | Tax Assessment Tax Assessment Total Assessment is a certain percentage of the fair market value that is determined by local assessors to be the total taxable value of land and additions on the property. | Land | Improvement |
|---|---|---|---|---|
| 2024 | $3,577 | $90,720 | $8,165 | $82,555 |
| 2023 | $1,073 | $90,720 | $8,165 | $82,555 |
| 2022 | $754 | $47,200 | $7,988 | $39,212 |
| 2021 | $970 | $47,200 | $7,988 | $39,212 |
| 2020 | $687 | $49,926 | $8,000 | $41,926 |
| 2019 | $722 | $43,200 | $7,200 | $36,000 |
| 2018 | $647 | $39,560 | $7,200 | $32,360 |
| 2017 | $488 | $30,856 | $7,200 | $23,656 |
| 2016 | $494 | $31,116 | $7,200 | $23,916 |
| 2015 | $485 | $0 | $0 | $0 |
| 2014 | $433 | $29,737 | $7,200 | $22,537 |
Source: Public Records
Map
Nearby Homes
- 3353 Medina Dr
- 7166 Thunder Ridge
- 3401 Mosswood Ln
- 3189 Glen Hollow Dr
- 3193 Medina Dr
- 7106 Oakwood Cir Unit 1
- 7101 Hazelwood Dr Unit 8
- 3140 Glen Hollow Dr
- 3145 Deerfield Way
- 7074 Babbling Brook Dr
- 3087 Drexel Ln
- 7161 Laurel Creek Dr
- 3552 Topaz Terrace
- 7442 Pine Brook Rd
- 6870 Diamond Dr
- 6891 Dresden Dr
- 7274 Mountain Laurel Way
- 3360 Brookside Ln
- 3376 Brookside Ln Unit 2
- 0 Brookside Ln Unit 3259473
- 0 Brookside Ln Unit 8448233
- 0 Brookside Ln Unit 8338806
- 0 Brookside Ln Unit 7614151
- 0 Brookside Ln Unit 3246949
- 0 Brookside Ln Unit 3132200
- 0 Brookside Ln Unit 3083661
- 3352 Brookside Ln
- 3363 Brookside Ln Unit 2
- 3379 Brookside Ln Unit 2
- 3344 Brookside Ln
- 3392 Brookside Ln
- 3387 Brookside Ln
- 3400 Brookside Ln Unit 2
- 3336 Brookside Ln
- 3372 Medina Dr Unit 2
- 3395 Brookside Ln Unit 2
- 3350 Medina Dr Unit 2