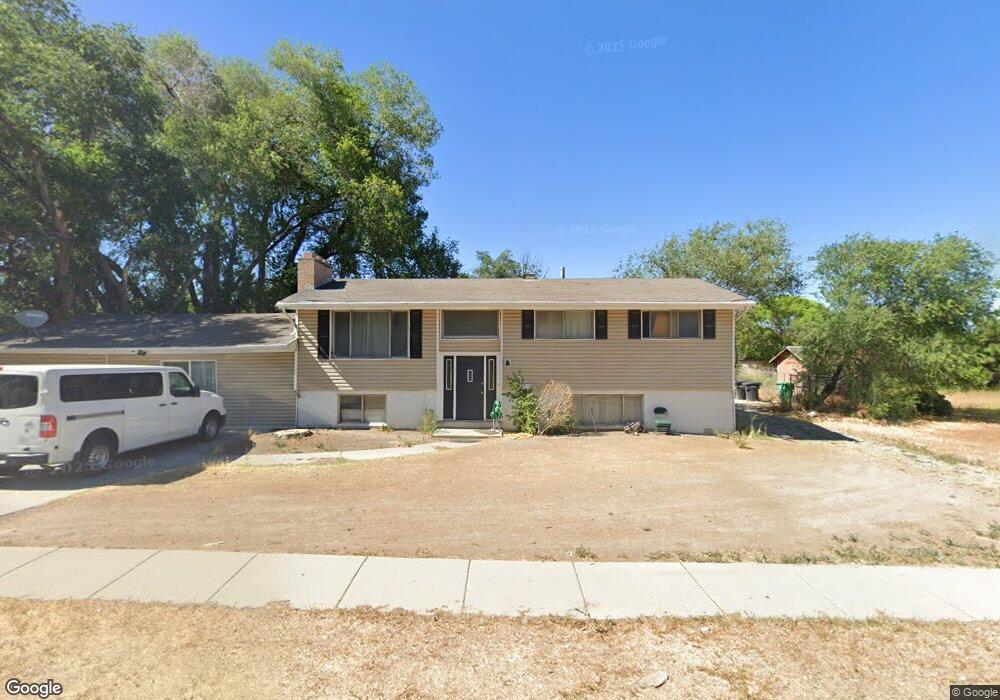
3368 Starlite Dr West Jordan, UT 84088
Estimated Value: $514,000 - $561,000
5
Beds
3
Baths
1,100
Sq Ft
$489/Sq Ft
Est. Value
About This Home
This home is located at 3368 Starlite Dr, West Jordan, UT 84088 and is currently estimated at $537,382, approximately $488 per square foot. 3368 Starlite Dr is a home located in Salt Lake County with nearby schools including Terra Linda Elementary School, Joel P. Jensen Middle School, and West Jordan High School.
Ownership History
Date
Name
Owned For
Owner Type
Purchase Details
Closed on
Oct 24, 2022
Sold by
Fonua Tangivale Funaki
Bought by
Fonua Tangivale and Levatau Aisea
Current Estimated Value
Home Financials for this Owner
Home Financials are based on the most recent Mortgage that was taken out on this home.
Original Mortgage
$476,215
Outstanding Balance
$460,255
Interest Rate
6.87%
Mortgage Type
FHA
Estimated Equity
$77,127
Purchase Details
Closed on
Dec 19, 2016
Sold by
Callister Alma A and Callister Audrey D
Bought by
Denos Jonathan Willyns and Denos Laura
Home Financials for this Owner
Home Financials are based on the most recent Mortgage that was taken out on this home.
Original Mortgage
$265,010
Interest Rate
4.25%
Mortgage Type
FHA
Create a Home Valuation Report for This Property
The Home Valuation Report is an in-depth analysis detailing your home's value as well as a comparison with similar homes in the area
Home Values in the Area
Average Home Value in this Area
Purchase History
| Date | Buyer | Sale Price | Title Company |
|---|---|---|---|
| Fonua Tangivale | -- | Novation Title Insurance Agenc | |
| Fonua Tangivale Funaki | -- | Meridian Title | |
| Denos Jonathan Willyns | -- | Old Republic Title |
Source: Public Records
Mortgage History
| Date | Status | Borrower | Loan Amount |
|---|---|---|---|
| Open | Fonua Tangivale Funaki | $476,215 | |
| Closed | Fonua Tangivale Funaki | $28,570 | |
| Previous Owner | Denos Jonathan Willyns | $265,010 |
Source: Public Records
Tax History Compared to Growth
Tax History
| Year | Tax Paid | Tax Assessment Tax Assessment Total Assessment is a certain percentage of the fair market value that is determined by local assessors to be the total taxable value of land and additions on the property. | Land | Improvement |
|---|---|---|---|---|
| 2025 | $2,519 | $523,300 | $178,400 | $344,900 |
| 2024 | $2,519 | $484,700 | $171,500 | $313,200 |
| 2023 | $2,519 | $468,200 | $161,300 | $306,900 |
| 2022 | $1,955 | $452,100 | $158,200 | $293,900 |
| 2021 | $1,440 | $334,100 | $131,800 | $202,300 |
| 2020 | $1,424 | $315,900 | $131,800 | $184,100 |
| 2019 | $1,361 | $300,300 | $110,700 | $189,600 |
| 2018 | $1,193 | $271,500 | $103,100 | $168,400 |
| 2017 | $1,693 | $249,800 | $103,100 | $146,700 |
| 2016 | $1,466 | $203,200 | $108,600 | $94,600 |
| 2015 | $1,447 | $195,600 | $110,600 | $85,000 |
| 2014 | $1,319 | $175,600 | $100,200 | $75,400 |
Source: Public Records
Map
Nearby Homes
- 8058 S Lismore Ln Unit 304
- 8180 S Old Bingham Hwy
- 3332 Lower Newark Way
- 3546 W 7980 S
- 3476 W Spaulding Rd
- 7991 S 3725 W
- 7989 S 3725 W
- 3354 W 7800 S
- 3647 W 7865 S
- 3112 Green Acre Dr
- 3629 W 7825 S
- 3066 W Linton Dr
- 8493 S 3200 W
- 7987 S 2980 W
- 8461 S Meadowlark Ln
- 8407 Meadow Green Way
- 3422 Briar Dr
- 3165 W 7720 S
- 7611 S Springbrook Dr
- 7942 S 2800 W
- 3368 W Starlite Dr
- 3346 Starlite Dr
- 3346 W Starlite Dr
- 8103 Old Bingham Hwy
- 3353 Starlite Dr
- 3353 W Starlite Dr
- 3414 Pheasant Run Dr
- 8083 Old Bingham Hwy
- 3327 W Starlite Dr
- 3409 W 8070 S
- 3426 Pheasant Run Dr
- 3426 W Pheasant Run Dr
- 3322 Starlite Dr
- 3425 W 8070 S
- 8159 Old Bingham Hwy
- 8159 S Old Bingham Hwy
- 3438 Pheasant Run Dr
- 8066 S Lismore Ln
- 8066 Lismore Ln
- 3303 W Starlite Dr