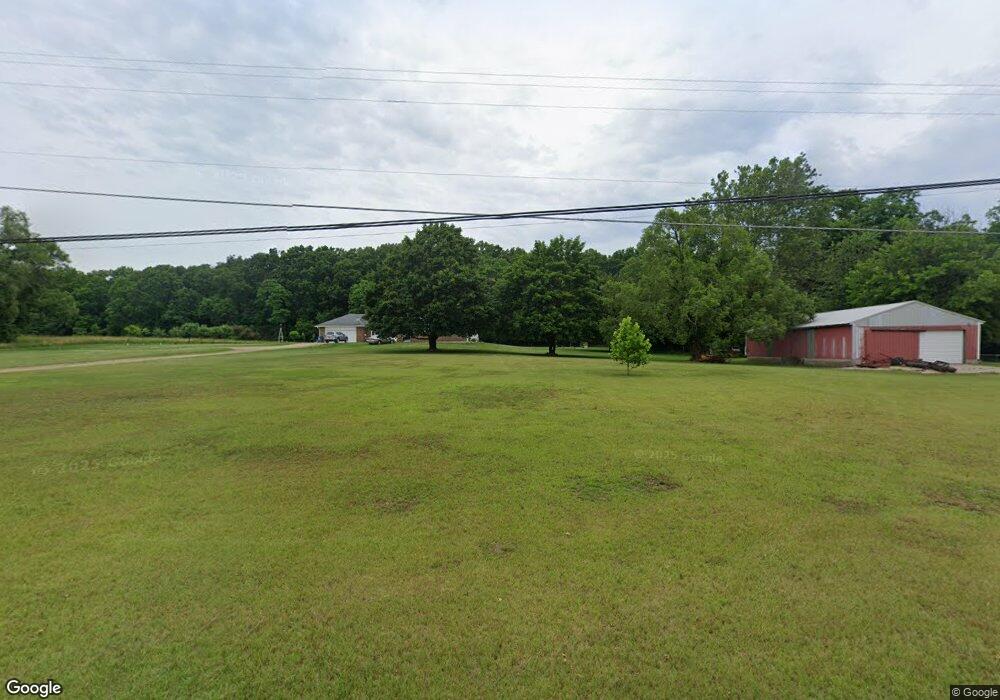
3369 113th Ave Allegan, MI 49010
Estimated Value: $290,000 - $397,000
3
Beds
2
Baths
1,696
Sq Ft
$202/Sq Ft
Est. Value
About This Home
This home is located at 3369 113th Ave, Allegan, MI 49010 and is currently estimated at $342,897, approximately $202 per square foot. 3369 113th Ave is a home located in Allegan County with nearby schools including West Ward Elementary School, L.E. White Middle School, and Allegan High School.
Ownership History
Date
Name
Owned For
Owner Type
Purchase Details
Closed on
Dec 5, 2013
Sold by
Kelley Sheila Marie and Fargo George
Bought by
Kelley Sheila Marie and Kelley Reggie Lee
Current Estimated Value
Purchase Details
Closed on
Apr 13, 2010
Sold by
Fargo George and Fargo Mary
Bought by
Fargo George and Fargo Mary
Purchase Details
Closed on
Jul 24, 2007
Sold by
Fargo George and Fargo Mary
Bought by
Fargo George and Fargo Mary
Create a Home Valuation Report for This Property
The Home Valuation Report is an in-depth analysis detailing your home's value as well as a comparison with similar homes in the area
Home Values in the Area
Average Home Value in this Area
Purchase History
| Date | Buyer | Sale Price | Title Company |
|---|---|---|---|
| Kelley Sheila Marie | -- | None Available | |
| Fargo George | -- | None Available | |
| Fargo George | -- | None Available |
Source: Public Records
Tax History Compared to Growth
Tax History
| Year | Tax Paid | Tax Assessment Tax Assessment Total Assessment is a certain percentage of the fair market value that is determined by local assessors to be the total taxable value of land and additions on the property. | Land | Improvement |
|---|---|---|---|---|
| 2025 | $3,276 | $160,200 | $36,700 | $123,500 |
| 2024 | $2,979 | $151,800 | $35,900 | $115,900 |
| 2023 | $2,979 | $131,200 | $28,200 | $103,000 |
| 2022 | $2,979 | $117,200 | $27,200 | $90,000 |
| 2021 | $2,746 | $111,000 | $26,100 | $84,900 |
| 2020 | $2,746 | $102,000 | $24,700 | $77,300 |
| 2019 | $0 | $97,500 | $22,300 | $75,200 |
| 2018 | $0 | $91,700 | $23,500 | $68,200 |
| 2017 | $0 | $87,100 | $23,600 | $63,500 |
| 2016 | $0 | $81,900 | $22,000 | $59,900 |
| 2015 | -- | $81,900 | $22,000 | $59,900 |
| 2014 | -- | $76,500 | $22,100 | $54,400 |
| 2013 | -- | $76,200 | $22,700 | $53,500 |
Source: Public Records
Map
Nearby Homes