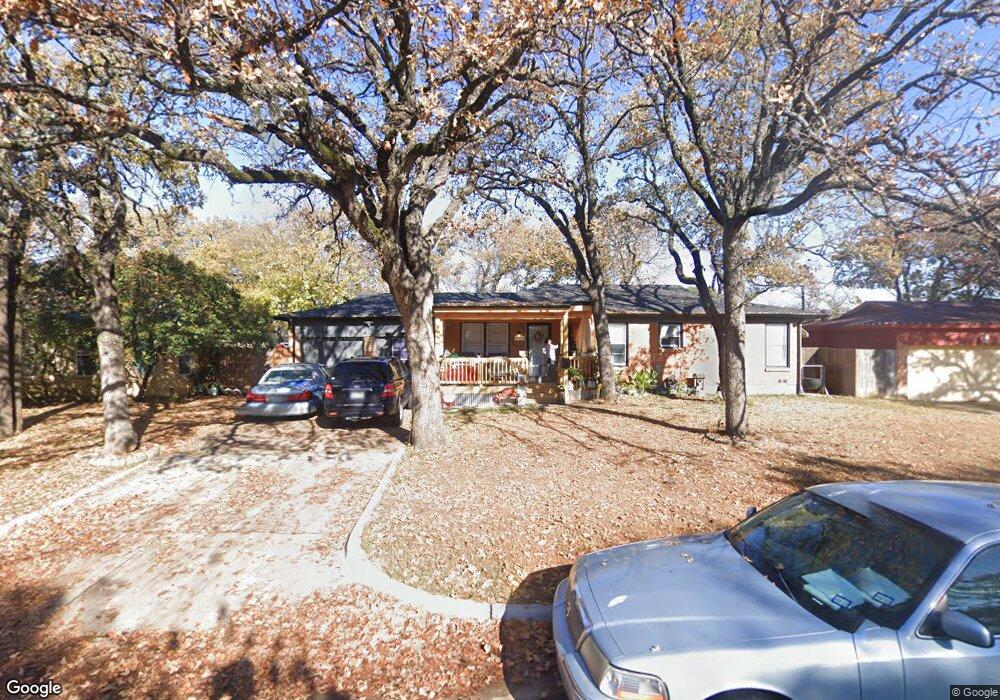
337 Bedford Ct E Bedford, TX 76022
Estimated Value: $290,398 - $311,000
3
Beds
2
Baths
1,727
Sq Ft
$174/Sq Ft
Est. Value
About This Home
This home is located at 337 Bedford Ct E, Bedford, TX 76022 and is currently estimated at $301,100, approximately $174 per square foot. 337 Bedford Ct E is a home located in Tarrant County with nearby schools including Stonegate Elementary School, Central J High School, and L.D. Bell High School.
Ownership History
Date
Name
Owned For
Owner Type
Purchase Details
Closed on
May 24, 2012
Sold by
Secretary Of Housing & Urban Development
Bought by
Watson Brian
Current Estimated Value
Home Financials for this Owner
Home Financials are based on the most recent Mortgage that was taken out on this home.
Original Mortgage
$26,500
Outstanding Balance
$18,361
Interest Rate
3.9%
Mortgage Type
Seller Take Back
Estimated Equity
$282,739
Purchase Details
Closed on
Dec 8, 2010
Sold by
Hang Blong and Lor Toulue
Bought by
Citimortgage Inc
Purchase Details
Closed on
Aug 20, 2001
Sold by
Hang Melissa S and Hang Jeff V
Bought by
Hang Blong and Lor Toulue
Home Financials for this Owner
Home Financials are based on the most recent Mortgage that was taken out on this home.
Original Mortgage
$87,624
Interest Rate
7.07%
Mortgage Type
FHA
Purchase Details
Closed on
Apr 19, 1994
Sold by
Ekrut Vernon and Ekrut Helen
Bought by
Hang Melissa S and Hang Jeff
Create a Home Valuation Report for This Property
The Home Valuation Report is an in-depth analysis detailing your home's value as well as a comparison with similar homes in the area
Home Values in the Area
Average Home Value in this Area
Purchase History
| Date | Buyer | Sale Price | Title Company |
|---|---|---|---|
| Watson Brian | $53,000 | None Available | |
| Citimortgage Inc | $104,180 | None Available | |
| Hang Blong | -- | Commonwealth Land Title | |
| Hang Melissa S | -- | Lawyers American Title Co |
Source: Public Records
Mortgage History
| Date | Status | Borrower | Loan Amount |
|---|---|---|---|
| Open | Watson Brian | $26,500 | |
| Previous Owner | Hang Blong | $87,624 |
Source: Public Records
Tax History Compared to Growth
Tax History
| Year | Tax Paid | Tax Assessment Tax Assessment Total Assessment is a certain percentage of the fair market value that is determined by local assessors to be the total taxable value of land and additions on the property. | Land | Improvement |
|---|---|---|---|---|
| 2025 | $950 | $284,709 | $55,000 | $229,709 |
| 2024 | $950 | $284,709 | $55,000 | $229,709 |
| 2023 | $1,837 | $266,038 | $35,000 | $231,038 |
| 2022 | $1,902 | $215,727 | $35,000 | $180,727 |
| 2021 | $1,865 | $219,428 | $35,000 | $184,428 |
| 2020 | $1,711 | $172,486 | $35,000 | $137,486 |
| 2019 | $1,589 | $165,866 | $35,000 | $130,866 |
| 2018 | $563 | $59,472 | $16,000 | $43,472 |
| 2017 | $1,308 | $133,564 | $16,000 | $117,564 |
| 2016 | $1,189 | $49,150 | $16,000 | $33,150 |
| 2015 | $1,056 | $53,000 | $15,000 | $38,000 |
| 2014 | $1,056 | $53,000 | $15,000 | $38,000 |
Source: Public Records
Map
Nearby Homes
- 344 Bedford Ct E
- 1112 Ann St
- 341 Hurst Dr
- 1008 Russell Ln
- 905 Brown Trail
- 1236 King Dr
- 501 Merrill Dr
- 849 Russell Ln
- 803 Glenda Dr
- 802 Brown Trail
- 1108 Wade Dr
- 933 Wade Dr
- 49 Coffee Tavern Rd
- 1220 Norwood Dr
- 1136 Simpson Dr
- 604 Donna Ln
- 116 Oakhurst Dr
- 1348 Norwood Dr
- 832 Chateau Valee Cir
- 1352 Simpson Dr
- 333 Bedford Ct E
- 341 Bedford Ct E
- 340 Belle St
- 336 Belle St
- 329 Bedford Ct E
- 345 Bedford Ct E
- 344 Belle St
- 332 Belle St
- 332 Bedford Ct E
- 340 Bedford Ct E
- 348 Belle St
- 328 Bedford Ct E
- 328 Bedford Ct E Unit 132
- 328 Bedford Ct E Unit 127
- 328 Bedford Ct E Unit 213
- 328 Bedford Ct E Unit 240
- 328 Bedford Ct E Unit 358
- 328 Bedford Ct E Unit 344
- 328 Bedford Ct E Unit 265
- 328 Bedford Ct E Unit 317