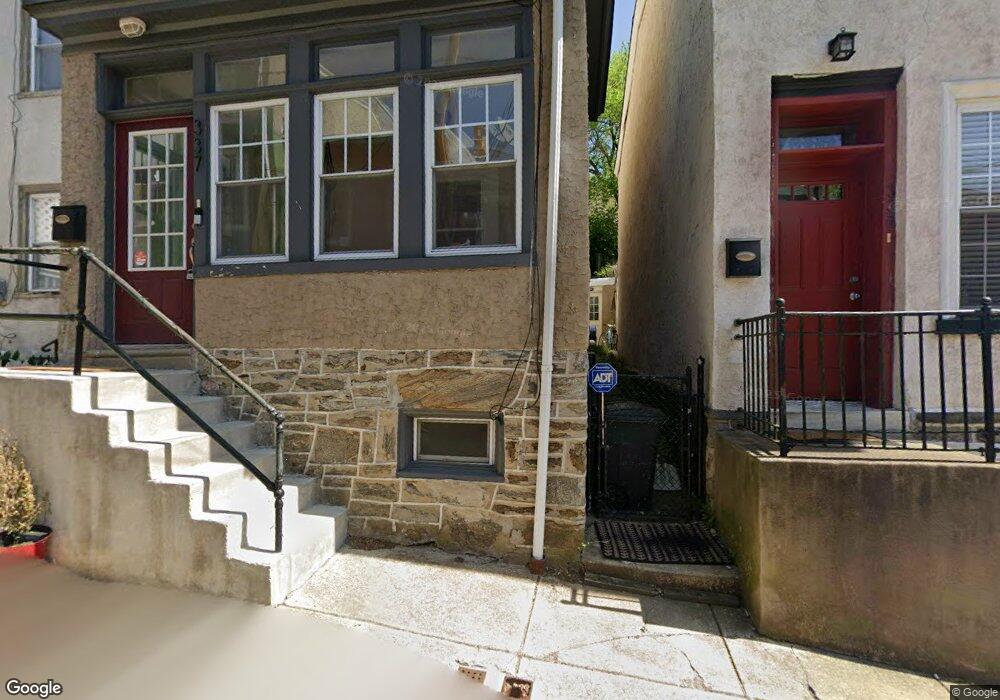
337 Carson St Philadelphia, PA 19128
Manayunk NeighborhoodEstimated Value: $298,031 - $423,000
3
Beds
3
Baths
1,288
Sq Ft
$286/Sq Ft
Est. Value
About This Home
This home is located at 337 Carson St, Philadelphia, PA 19128 and is currently estimated at $369,008, approximately $286 per square foot. 337 Carson St is a home located in Philadelphia County with nearby schools including White Oaks Elementary School, James Dobson Elementary School, and Roxborough High School.
Ownership History
Date
Name
Owned For
Owner Type
Purchase Details
Closed on
Mar 5, 2008
Sold by
Landmonster Inc
Bought by
Rattigan Michael
Current Estimated Value
Home Financials for this Owner
Home Financials are based on the most recent Mortgage that was taken out on this home.
Original Mortgage
$288,000
Outstanding Balance
$176,127
Interest Rate
5.57%
Mortgage Type
Purchase Money Mortgage
Estimated Equity
$192,881
Purchase Details
Closed on
Jun 4, 2007
Sold by
Lepak Joseph L and Sosnowski Joseph
Bought by
Landmonster Inc
Create a Home Valuation Report for This Property
The Home Valuation Report is an in-depth analysis detailing your home's value as well as a comparison with similar homes in the area
Home Values in the Area
Average Home Value in this Area
Purchase History
| Date | Buyer | Sale Price | Title Company |
|---|---|---|---|
| Rattigan Michael | $360,000 | None Available | |
| Landmonster Inc | $165,500 | None Available |
Source: Public Records
Mortgage History
| Date | Status | Borrower | Loan Amount |
|---|---|---|---|
| Open | Rattigan Michael | $288,000 |
Source: Public Records
Tax History Compared to Growth
Tax History
| Year | Tax Paid | Tax Assessment Tax Assessment Total Assessment is a certain percentage of the fair market value that is determined by local assessors to be the total taxable value of land and additions on the property. | Land | Improvement |
|---|---|---|---|---|
| 2026 | $3,374 | $259,800 | $51,900 | $207,900 |
| 2025 | $3,374 | $259,800 | $51,900 | $207,900 |
| 2024 | $3,374 | $259,800 | $51,900 | $207,900 |
| 2023 | $3,374 | $241,000 | $48,200 | $192,800 |
| 2022 | $2,228 | $196,000 | $48,200 | $147,800 |
| 2021 | $2,858 | $0 | $0 | $0 |
| 2020 | $2,858 | $0 | $0 | $0 |
| 2019 | $2,809 | $0 | $0 | $0 |
| 2018 | $2,462 | $0 | $0 | $0 |
| 2017 | $2,462 | $0 | $0 | $0 |
| 2016 | $2,042 | $0 | $0 | $0 |
| 2015 | $1,955 | $0 | $0 | $0 |
| 2014 | -- | $175,900 | $35,909 | $139,991 |
| 2012 | -- | $18,176 | $2,782 | $15,394 |
Source: Public Records
Map
Nearby Homes