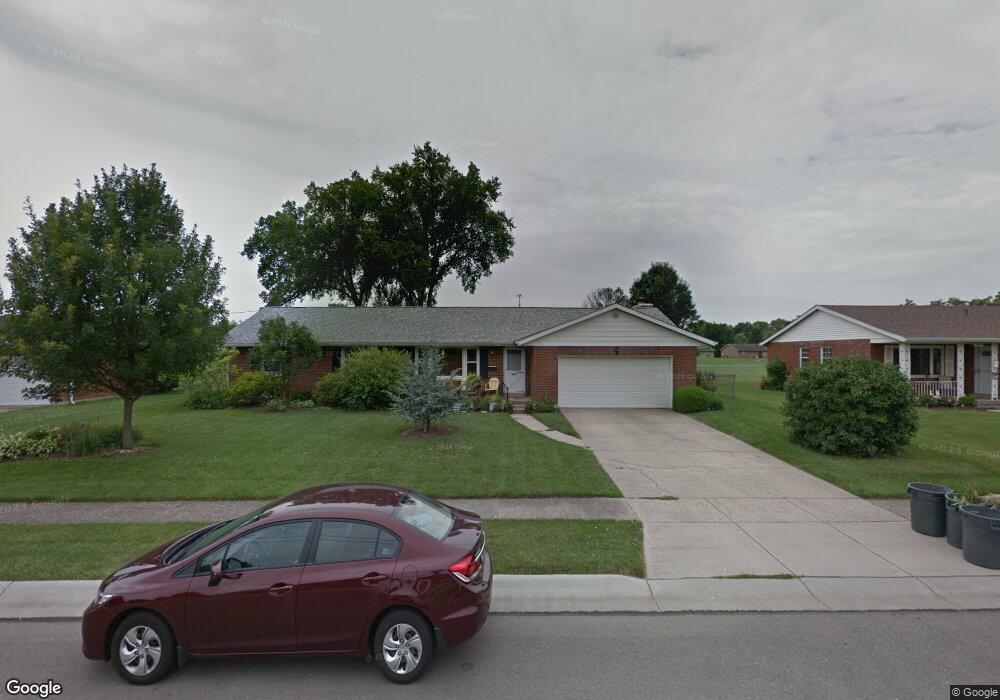
337 Fenwick Dr Fairfield, OH 45014
Estimated Value: $278,000 - $325,000
3
Beds
2
Baths
1,604
Sq Ft
$191/Sq Ft
Est. Value
About This Home
This home is located at 337 Fenwick Dr, Fairfield, OH 45014 and is currently estimated at $305,654, approximately $190 per square foot. 337 Fenwick Dr is a home located in Butler County with nearby schools including Fairfield West Elementary School, Creekside Middle School, and Fairfield Senior High School.
Ownership History
Date
Name
Owned For
Owner Type
Purchase Details
Closed on
Aug 27, 2003
Sold by
Montgomery Catherine T
Bought by
Ruble Craig M and Montgomery Ann M
Current Estimated Value
Home Financials for this Owner
Home Financials are based on the most recent Mortgage that was taken out on this home.
Original Mortgage
$127,492
Outstanding Balance
$55,007
Interest Rate
5.69%
Mortgage Type
FHA
Estimated Equity
$250,647
Purchase Details
Closed on
Feb 1, 1989
Purchase Details
Closed on
Aug 1, 1985
Create a Home Valuation Report for This Property
The Home Valuation Report is an in-depth analysis detailing your home's value as well as a comparison with similar homes in the area
Home Values in the Area
Average Home Value in this Area
Purchase History
| Date | Buyer | Sale Price | Title Company |
|---|---|---|---|
| Ruble Craig M | $128,000 | Acs Title & Closing Services | |
| -- | $79,000 | -- | |
| -- | $74,900 | -- |
Source: Public Records
Mortgage History
| Date | Status | Borrower | Loan Amount |
|---|---|---|---|
| Open | Ruble Craig M | $127,492 |
Source: Public Records
Tax History
| Year | Tax Paid | Tax Assessment Tax Assessment Total Assessment is a certain percentage of the fair market value that is determined by local assessors to be the total taxable value of land and additions on the property. | Land | Improvement |
|---|---|---|---|---|
| 2025 | $3,066 | $83,230 | $13,660 | $69,570 |
| 2024 | $3,066 | $83,230 | $13,660 | $69,570 |
| 2023 | $3,051 | $84,720 | $13,660 | $71,060 |
| 2022 | $2,780 | $58,300 | $13,660 | $44,640 |
| 2021 | $2,408 | $57,420 | $13,660 | $43,760 |
| 2020 | $2,505 | $57,420 | $13,660 | $43,760 |
| 2019 | $4,378 | $50,710 | $14,450 | $36,260 |
| 2018 | $2,513 | $50,710 | $14,450 | $36,260 |
| 2017 | $2,538 | $50,710 | $14,450 | $36,260 |
| 2016 | $2,539 | $48,290 | $14,450 | $33,840 |
| 2015 | $2,417 | $48,290 | $14,450 | $33,840 |
| 2014 | $2,314 | $48,960 | $14,450 | $34,510 |
| 2013 | $2,314 | $44,950 | $17,460 | $27,490 |
Source: Public Records
Map
Nearby Homes
- 210 Littlebrook Dr
- 336 Lauryn Meadows Ct
- 512 Fenwick Dr
- 644 Doris Jane Ave
- 664 Walter Ave
- 745 Magie Ave
- 5180 Suwannee Dr
- 4957 Castleton Dr
- 810 Shady Ln
- 5154 Lamonte Dr
- 3302 Village Dr
- 4845 Slade Dr
- 4708 Fairfield Ave
- 6271 River Rd
- 3865 Arlington Ave
- 0 Foster Ave
- 941 Foster Ave
- 5591 Lindenwood Ln
- 5794 River Rd
- 5406 Oakbrook Dr
Your Personal Tour Guide
Ask me questions while you tour the home.