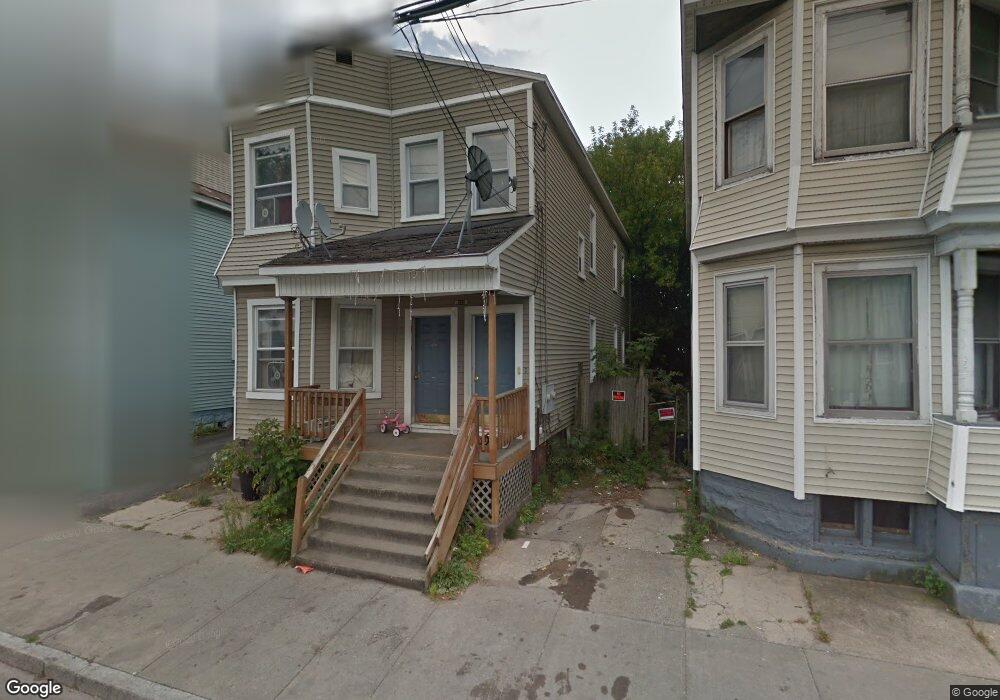
337 Hulett St Schenectady, NY 12307
Hamilton Hill NeighborhoodEstimated Value: $146,361 - $254,000
8
Beds
2
Baths
2,562
Sq Ft
$75/Sq Ft
Est. Value
About This Home
This home is located at 337 Hulett St, Schenectady, NY 12307 and is currently estimated at $192,590, approximately $75 per square foot. 337 Hulett St is a home located in Schenectady County with nearby schools including Martin Luther King School, Oneida Middle School, and Schenectady High School.
Ownership History
Date
Name
Owned For
Owner Type
Purchase Details
Closed on
Sep 12, 2017
Sold by
Callender Kim
Bought by
Clinton Homes
Current Estimated Value
Purchase Details
Closed on
Mar 28, 2005
Sold by
337 Hulett Street Trust
Bought by
Callender Kim
Home Financials for this Owner
Home Financials are based on the most recent Mortgage that was taken out on this home.
Original Mortgage
$46,750
Interest Rate
7.87%
Mortgage Type
Adjustable Rate Mortgage/ARM
Purchase Details
Closed on
Jun 26, 1996
Create a Home Valuation Report for This Property
The Home Valuation Report is an in-depth analysis detailing your home's value as well as a comparison with similar homes in the area
Home Values in the Area
Average Home Value in this Area
Purchase History
| Date | Buyer | Sale Price | Title Company |
|---|---|---|---|
| Clinton Homes | -- | None Available | |
| Callender Kim | $55,000 | Peter G Ford | |
| -- | -- | -- |
Source: Public Records
Mortgage History
| Date | Status | Borrower | Loan Amount |
|---|---|---|---|
| Previous Owner | Callender Kim | $46,750 |
Source: Public Records
Tax History
| Year | Tax Paid | Tax Assessment Tax Assessment Total Assessment is a certain percentage of the fair market value that is determined by local assessors to be the total taxable value of land and additions on the property. | Land | Improvement |
|---|---|---|---|---|
| 2024 | $4,102 | $57,100 | $8,600 | $48,500 |
| 2023 | $40 | $57,100 | $8,600 | $48,500 |
| 2022 | $3,779 | $57,100 | $8,600 | $48,500 |
| 2021 | $3,743 | $57,100 | $8,600 | $48,500 |
| 2020 | $3,665 | $57,100 | $8,600 | $48,500 |
| 2019 | $2,482 | $57,100 | $8,600 | $48,500 |
| 2018 | $3,693 | $57,100 | $8,600 | $48,500 |
| 2017 | $2,929 | $57,100 | $8,600 | $48,500 |
| 2016 | $3,753 | $57,100 | $8,600 | $48,500 |
| 2015 | -- | $57,100 | $8,600 | $48,500 |
| 2014 | -- | $57,100 | $8,600 | $48,500 |
Source: Public Records
Map
Nearby Homes
- 347 Hulett St
- 750 Hamilton St
- 740 Hamilton St
- 1013 Delamont Ave
- 320 Germania Ave
- 28 Steuben St
- 421 Summit Ave
- 1 Chestnut St
- 821 Strong St
- 420 Summit Ave
- 312 Georgetta Dix Plaza
- 510 Mumford St
- 494 Hulett St
- 11 Mynderse St
- 222 Duane Ave
- 515 Summit Ave
- 806 Strong St
- 114 Victory Ave
- 885 Emmett St
- 546 Paige St
Your Personal Tour Guide
Ask me questions while you tour the home.