337 Jimmy Ct Unit 7 Sparks, NV 89436
Eagle Canyon-Pebble Creek NeighborhoodEstimated Value: $525,000 - $555,000
3
Beds
2
Baths
1,559
Sq Ft
$345/Sq Ft
Est. Value
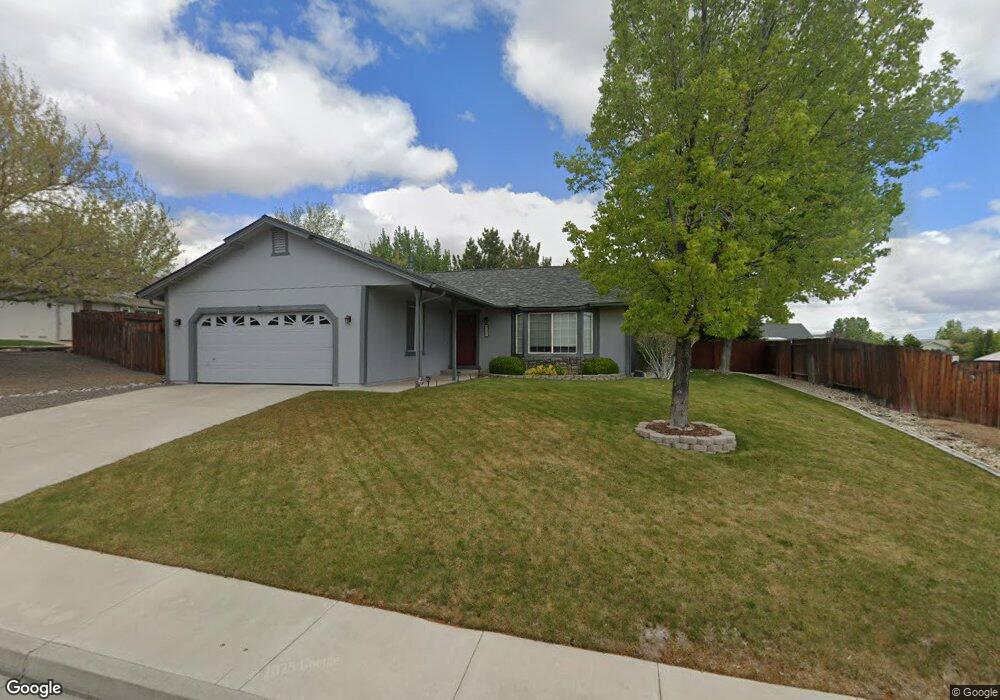
About This Home
This home is located at 337 Jimmy Ct Unit 7, Sparks, NV 89436 and is currently estimated at $537,368, approximately $344 per square foot. 337 Jimmy Ct Unit 7 is a home located in Washoe County with nearby schools including Jesse Hall Elementery School, Yvonne Shaw Middle School, and Spanish Springs High School.
Ownership History
Date
Name
Owned For
Owner Type
Purchase Details
Closed on
Jul 15, 2015
Sold by
Tipton Joyce E
Bought by
Tipton Joyce E
Current Estimated Value
Purchase Details
Closed on
Mar 31, 2003
Sold by
Tipton Ron E
Bought by
Tipton Joyce E
Home Financials for this Owner
Home Financials are based on the most recent Mortgage that was taken out on this home.
Original Mortgage
$148,750
Outstanding Balance
$64,324
Interest Rate
5.84%
Estimated Equity
$473,044
Purchase Details
Closed on
Oct 9, 1996
Sold by
Hawco Investment & Development Co Inc
Bought by
Tipton Ron E and Tipton Joyce E
Home Financials for this Owner
Home Financials are based on the most recent Mortgage that was taken out on this home.
Original Mortgage
$129,540
Interest Rate
8.1%
Mortgage Type
FHA
Create a Home Valuation Report for This Property
The Home Valuation Report is an in-depth analysis detailing your home's value as well as a comparison with similar homes in the area
Home Values in the Area
Average Home Value in this Area
Purchase History
| Date | Buyer | Sale Price | Title Company |
|---|---|---|---|
| Tipton Joyce E | -- | Capital Title Co Of Nevada | |
| Tipton Joyce E | $148,750 | Stewart Title Of Northern Nv | |
| Tipton Ron E | $132,500 | Founders Title Co |
Source: Public Records
Mortgage History
| Date | Status | Borrower | Loan Amount |
|---|---|---|---|
| Open | Tipton Joyce E | $148,750 | |
| Closed | Tipton Ron E | $129,540 |
Source: Public Records
Tax History Compared to Growth
Tax History
| Year | Tax Paid | Tax Assessment Tax Assessment Total Assessment is a certain percentage of the fair market value that is determined by local assessors to be the total taxable value of land and additions on the property. | Land | Improvement |
|---|---|---|---|---|
| 2025 | $2,076 | $93,402 | $39,270 | $54,132 |
| 2024 | $2,076 | $91,291 | $36,610 | $54,681 |
| 2023 | $2,018 | $88,958 | $37,065 | $51,893 |
| 2022 | $1,961 | $75,713 | $32,340 | $43,373 |
| 2021 | $1,905 | $66,711 | $23,380 | $43,331 |
| 2020 | $1,807 | $65,242 | $23,135 | $42,107 |
| 2019 | $1,756 | $62,878 | $22,050 | $40,828 |
| 2018 | $1,707 | $55,813 | $15,750 | $40,063 |
| 2017 | $1,657 | $54,875 | $14,630 | $40,245 |
| 2016 | $1,613 | $54,696 | $13,615 | $41,081 |
| 2015 | $1,612 | $52,343 | $11,165 | $41,178 |
| 2014 | $1,564 | $50,078 | $10,395 | $39,683 |
| 2013 | -- | $47,216 | $7,980 | $39,236 |
Source: Public Records
Map
Nearby Homes
- 335 Veronica Ave
- 195 Mia Dr
- 195 Monumental Cir
- 170 Veronica Ave
- 2755 Falcon View Ct
- 256 Tankersley Dr
- 108 Josefina Ct
- 132 Midas Ct
- 284 Arlis Place
- 282 Arlis Place
- 748 Tufa Dr
- The Vineyard Plan at Silverado Village
- The Nantucket Plan at Silverado Village
- The Newport Plan at Silverado Village
- The Cape Plan at Silverado Village
- 20 Tankersley Ct
- 30 Horse Springs Dr
- 1359 Nightingale Way Unit 4
- 1320 Longspur Way
- 7405 Robert Banks Blvd