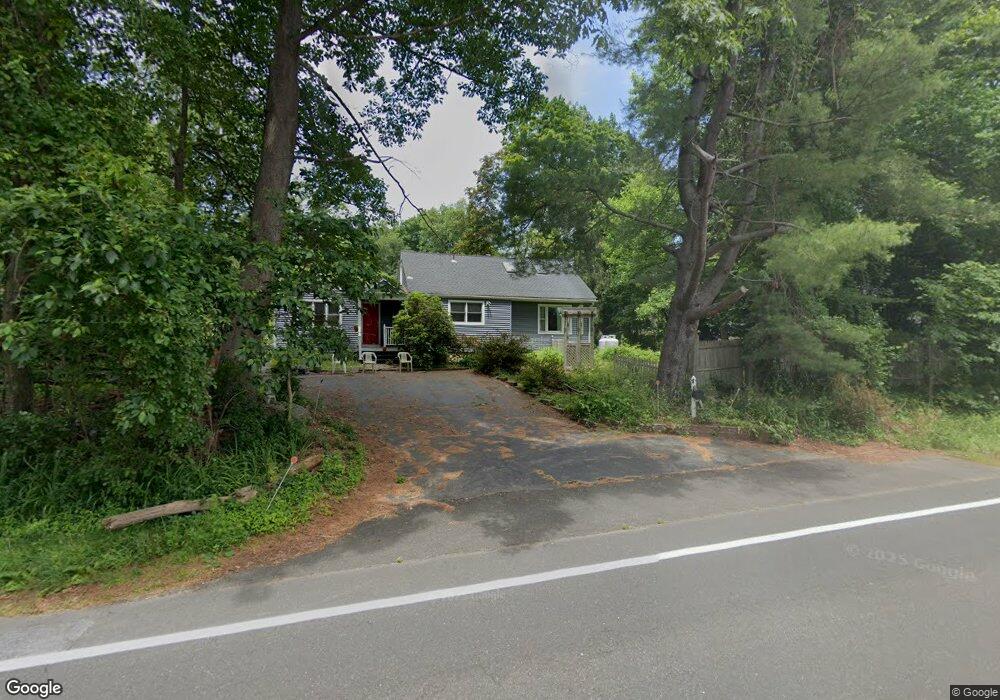
337 Leavenworth Rd Shelton, CT 06484
Estimated Value: $410,892 - $497,000
2
Beds
1
Bath
1,438
Sq Ft
$314/Sq Ft
Est. Value
About This Home
This home is located at 337 Leavenworth Rd, Shelton, CT 06484 and is currently estimated at $450,973, approximately $313 per square foot. 337 Leavenworth Rd is a home located in Fairfield County with nearby schools including Elizabeth Shelton Elementary School, Perry Hill School, and Shelton Intermediate School.
Ownership History
Date
Name
Owned For
Owner Type
Purchase Details
Closed on
Oct 19, 2019
Sold by
Peter Laskos and Peter Jeanet Laskos
Bought by
Laskos Monica
Current Estimated Value
Purchase Details
Closed on
Jun 10, 2019
Sold by
Jp Morgan Chase Bank Na
Bought by
Laskos Peter and Laskos Jeanet
Purchase Details
Closed on
Apr 4, 2012
Sold by
Nagle Jennifer
Bought by
Nagle Timothy
Purchase Details
Closed on
Feb 19, 2008
Sold by
Urbano Gloria and Devlin Harry
Bought by
Nagle Timothy and Nagle Jennifer
Home Financials for this Owner
Home Financials are based on the most recent Mortgage that was taken out on this home.
Original Mortgage
$267,850
Interest Rate
6.14%
Purchase Details
Closed on
Mar 23, 2001
Sold by
Todisco Robert
Bought by
Devlin Harry and Urbano Gloria
Create a Home Valuation Report for This Property
The Home Valuation Report is an in-depth analysis detailing your home's value as well as a comparison with similar homes in the area
Home Values in the Area
Average Home Value in this Area
Purchase History
| Date | Buyer | Sale Price | Title Company |
|---|---|---|---|
| Laskos Monica | -- | -- | |
| Laskos Monica | -- | -- | |
| Laskos Peter | $115,500 | -- | |
| Laskos Peter | $115,500 | -- | |
| Nagle Timothy | -- | -- | |
| Nagle Timothy | -- | -- | |
| Nagle Timothy | $270,000 | -- | |
| Nagle Timothy | $270,000 | -- | |
| Devlin Harry | $207,000 | -- | |
| Devlin Harry | $207,000 | -- |
Source: Public Records
Mortgage History
| Date | Status | Borrower | Loan Amount |
|---|---|---|---|
| Previous Owner | Devlin Harry | $271,867 | |
| Previous Owner | Devlin Harry | $267,850 |
Source: Public Records
Tax History Compared to Growth
Tax History
| Year | Tax Paid | Tax Assessment Tax Assessment Total Assessment is a certain percentage of the fair market value that is determined by local assessors to be the total taxable value of land and additions on the property. | Land | Improvement |
|---|---|---|---|---|
| 2025 | $3,752 | $199,360 | $84,280 | $115,080 |
| 2024 | $3,824 | $199,360 | $84,280 | $115,080 |
| 2023 | $3,483 | $199,360 | $84,280 | $115,080 |
| 2022 | $3,483 | $199,360 | $84,280 | $115,080 |
| 2021 | $3,209 | $145,670 | $56,070 | $89,600 |
| 2020 | $3,266 | $145,670 | $56,070 | $89,600 |
| 2019 | $3,266 | $145,670 | $56,070 | $89,600 |
| 2017 | $3,236 | $145,680 | $56,070 | $89,610 |
| 2015 | $3,084 | $138,250 | $54,320 | $83,930 |
| 2014 | $3,084 | $138,250 | $54,320 | $83,930 |
Source: Public Records
Map
Nearby Homes
- 20 Nicholdale Rd
- 128 Barn Hill Rd
- 12 Millbrook Rd
- 96 Big Horn Rd
- 39 Short St
- 941 Constitution Blvd N
- 23 Revere Rd
- 36 Spinning Wheel Rd
- 44 Block Farm Rd
- 27 Osborn Ln
- 40 Walnut St
- 71 Old Dairy Ln
- 34 Birdseye Rd
- 30 E Village Rd
- 51 Tuckahoe Dr
- Lot A Abbey Ln
- 40 Winthrop Place
- 16 Cedar Hill Rd
- 16 Scenic Hill Rd Unit 16
- 3 Roosevelt Dr
- 66 Nicholdale Rd
- 77 Nicholdale Rd
- 71 Nicholdale Rd
- 81 Nicholdale Rd
- 54 Nicholdale Rd
- 58 Nicholdale Rd
- 59 Nicholdale Rd
- 75 Nicholdale Rd
- 322 Leavenworth Rd
- 55 Nicholdale Rd
- 46 Nicholdale Rd
- 67 Nicholdale Rd
- 45 Nicholdale Rd
- 46 Perch Rd
- 42 Perch Rd
- 41 Nicholdale Rd
- 315 Leavenworth Rd
- 38 Perch Rd
- 37 Nicholdale Rd
- 32 Nicholdale Rd