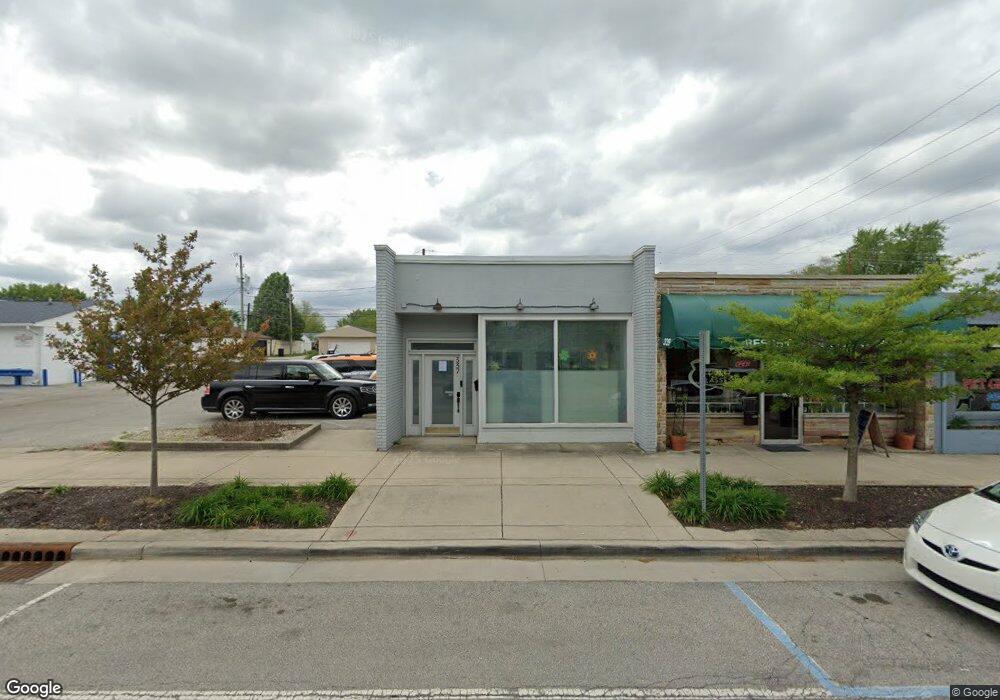
337 Main St Beech Grove, IN 46107
--
Bed
--
Bath
1,931
Sq Ft
--
Built
About This Home
This home is located at 337 Main St, Beech Grove, IN 46107. 337 Main St is a home located in Marion County with nearby schools including Hornet Park Elementary School, Central Elementary School, and South Grove Intermediate School.
Ownership History
Date
Name
Owned For
Owner Type
Purchase Details
Closed on
Jul 15, 2024
Sold by
Jldy Llc
Bought by
Fosfive Holdings Llc
Home Financials for this Owner
Home Financials are based on the most recent Mortgage that was taken out on this home.
Original Mortgage
$308,953
Outstanding Balance
$252,017
Interest Rate
6.29%
Mortgage Type
New Conventional
Purchase Details
Closed on
Jul 11, 2024
Sold by
Jldy Llc
Bought by
Fosfive Holdings Llc
Home Financials for this Owner
Home Financials are based on the most recent Mortgage that was taken out on this home.
Original Mortgage
$308,953
Outstanding Balance
$252,017
Interest Rate
6.29%
Mortgage Type
New Conventional
Purchase Details
Closed on
Jan 25, 2017
Sold by
Lopez Juan R
Create a Home Valuation Report for This Property
The Home Valuation Report is an in-depth analysis detailing your home's value as well as a comparison with similar homes in the area
Home Values in the Area
Average Home Value in this Area
Purchase History
| Date | Buyer | Sale Price | Title Company |
|---|---|---|---|
| Fosfive Holdings Llc | -- | None Listed On Document | |
| Fosfive Holdings Llc | $327,000 | None Listed On Document | |
| -- | -- | -- |
Source: Public Records
Mortgage History
| Date | Status | Borrower | Loan Amount |
|---|---|---|---|
| Open | Fosfive Holdings Llc | $308,953 | |
| Closed | Fosfive Holdings Llc | $308,953 |
Source: Public Records
Tax History Compared to Growth
Tax History
| Year | Tax Paid | Tax Assessment Tax Assessment Total Assessment is a certain percentage of the fair market value that is determined by local assessors to be the total taxable value of land and additions on the property. | Land | Improvement |
|---|---|---|---|---|
| 2024 | $4,452 | $117,500 | $37,000 | $80,500 |
| 2023 | $4,452 | $117,500 | $37,000 | $80,500 |
| 2022 | $4,138 | $107,200 | $37,000 | $70,200 |
| 2021 | $4,027 | $98,200 | $33,600 | $64,600 |
| 2020 | $3,538 | $98,200 | $33,600 | $64,600 |
| 2019 | $3,339 | $95,200 | $33,600 | $61,600 |
| 2018 | $3,346 | $97,800 | $33,600 | $64,200 |
| 2017 | $3,380 | $96,500 | $33,600 | $62,900 |
| 2016 | $3,289 | $94,600 | $33,600 | $61,000 |
| 2014 | $3,407 | $101,700 | $33,600 | $68,100 |
| 2013 | $3,652 | $79,300 | $11,200 | $68,100 |
Source: Public Records
Map
Nearby Homes