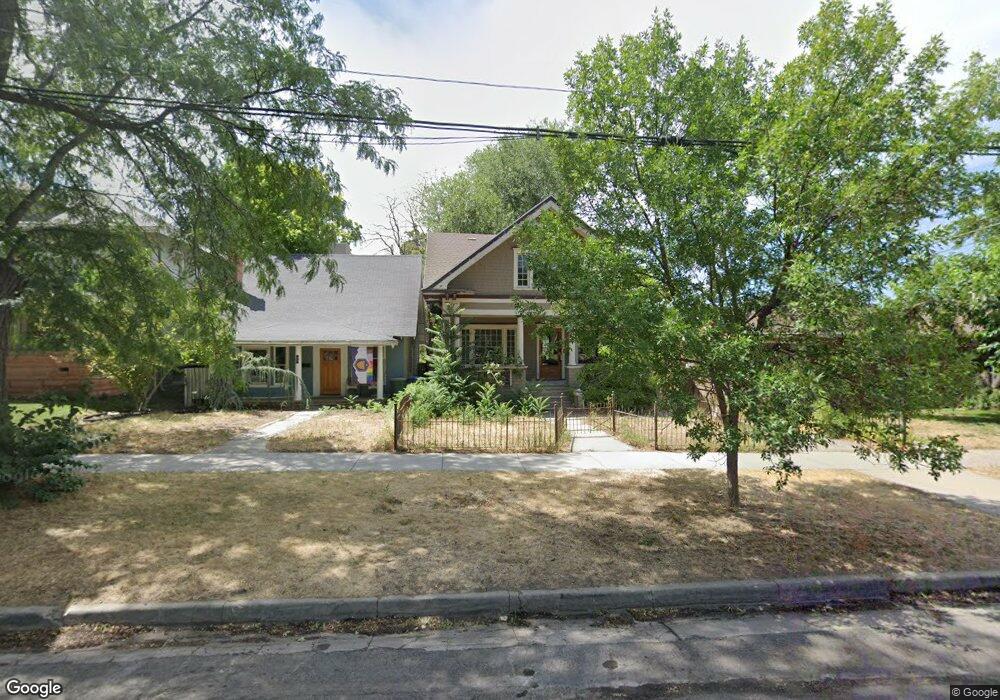
337 N 200 W Salt Lake City, UT 84103
Capitol Hill NeighborhoodEstimated Value: $580,000 - $733,000
4
Beds
2
Baths
4,000
Sq Ft
$165/Sq Ft
Est. Value
About This Home
This home is located at 337 N 200 W, Salt Lake City, UT 84103 and is currently estimated at $661,823, approximately $165 per square foot. 337 N 200 W is a home located in Salt Lake County with nearby schools including Washington School, West High, and Open Classroom.
Ownership History
Date
Name
Owned For
Owner Type
Purchase Details
Closed on
Dec 2, 2019
Sold by
Jones Jackson J
Bought by
Jones Jackson and Jones Rhea
Current Estimated Value
Home Financials for this Owner
Home Financials are based on the most recent Mortgage that was taken out on this home.
Original Mortgage
$300,000
Outstanding Balance
$264,493
Interest Rate
3.6%
Mortgage Type
New Conventional
Estimated Equity
$397,330
Purchase Details
Closed on
Nov 11, 2019
Sold by
Jones Brian
Bought by
Jones Jackson J
Home Financials for this Owner
Home Financials are based on the most recent Mortgage that was taken out on this home.
Original Mortgage
$300,000
Outstanding Balance
$264,493
Interest Rate
3.6%
Mortgage Type
New Conventional
Estimated Equity
$397,330
Purchase Details
Closed on
Sep 16, 2016
Sold by
Jones Bruce E
Bought by
Jones Brian
Purchase Details
Closed on
Aug 31, 2016
Sold by
Jones Brian
Bought by
Jones Jackson J
Purchase Details
Closed on
Oct 20, 2015
Sold by
Dillman Dee
Bought by
Jones Brian and Jones Bruce E
Home Financials for this Owner
Home Financials are based on the most recent Mortgage that was taken out on this home.
Original Mortgage
$296,250
Interest Rate
3.87%
Mortgage Type
New Conventional
Purchase Details
Closed on
Nov 26, 2013
Sold by
Dillman Dee H and Ginman Marie H
Bought by
Dillman David and Dee H Dillman Irrevocable Trust
Purchase Details
Closed on
Feb 22, 2013
Sold by
Dillman David
Bought by
Dillman Dee H and Ginman Marie H
Purchase Details
Closed on
Feb 20, 2009
Sold by
Dillman Dee H and Ginman Marie H
Bought by
Dillman David and Dee H Dillman Irrevocable Trust
Purchase Details
Closed on
Dec 22, 2008
Sold by
Dillman David
Bought by
Dillman Dee H
Purchase Details
Closed on
Oct 9, 2008
Sold by
Dillman Dee and Ginman Marie
Bought by
Dillman David and Dee H Dillman Irrevocable Trust
Purchase Details
Closed on
Mar 16, 2006
Sold by
Dillman David
Bought by
Dillman Dee and Ginman Marie
Purchase Details
Closed on
May 18, 2004
Sold by
Ginman Marie
Bought by
Dillman David and Dee H Dillman Irrevocable Trust
Purchase Details
Closed on
Jan 28, 1998
Sold by
Parchinski Michelle
Bought by
Dillman Dee and Ginman Marie
Home Financials for this Owner
Home Financials are based on the most recent Mortgage that was taken out on this home.
Original Mortgage
$116,000
Interest Rate
7.05%
Create a Home Valuation Report for This Property
The Home Valuation Report is an in-depth analysis detailing your home's value as well as a comparison with similar homes in the area
Home Values in the Area
Average Home Value in this Area
Purchase History
| Date | Buyer | Sale Price | Title Company |
|---|---|---|---|
| Jones Jackson | -- | Meridian Title | |
| Jones Jackson J | -- | None Available | |
| Jones Brian | -- | None Available | |
| Jones Jackson J | -- | None Available | |
| Jones Brian | -- | Pioneer Title Ins Agcy | |
| Dillman David | -- | Prionner Title Ins Agcy | |
| Dillman Dee H | -- | Backman Title Services | |
| Dillman David | -- | Backman Title Services | |
| Dillman Dee H | -- | Backman Title Services | |
| Dillman David | -- | None Available | |
| Dillman Dee | -- | Backman Title Services | |
| Dillman David | -- | Backman Stewart Title Svcs | |
| Ginman Marie | -- | Backman Stewart Title Svcs | |
| Dillman Dee | -- | -- |
Source: Public Records
Mortgage History
| Date | Status | Borrower | Loan Amount |
|---|---|---|---|
| Open | Jones Jackson | $300,000 | |
| Previous Owner | Jones Brian | $296,250 | |
| Previous Owner | Dillman Dee | $116,000 |
Source: Public Records
Tax History Compared to Growth
Tax History
| Year | Tax Paid | Tax Assessment Tax Assessment Total Assessment is a certain percentage of the fair market value that is determined by local assessors to be the total taxable value of land and additions on the property. | Land | Improvement |
|---|---|---|---|---|
| 2025 | $2,826 | $574,400 | $118,300 | $456,100 |
| 2024 | $2,826 | $539,300 | $112,000 | $427,300 |
| 2023 | $2,844 | $523,100 | $107,700 | $415,400 |
| 2022 | $3,129 | $539,900 | $105,600 | $434,300 |
| 2021 | $2,819 | $440,400 | $86,700 | $353,700 |
| 2020 | $2,681 | $398,700 | $77,400 | $321,300 |
| 2019 | $2,763 | $386,500 | $75,000 | $311,500 |
| 2018 | $2,386 | $325,100 | $75,000 | $250,100 |
| 2017 | $2,629 | $335,600 | $75,000 | $260,600 |
| 2016 | $2,636 | $319,500 | $63,100 | $256,400 |
| 2015 | $1,378 | $158,300 | $65,000 | $93,300 |
| 2014 | $1,302 | $148,400 | $63,700 | $84,700 |
Source: Public Records
Map
Nearby Homes
- 235 W 400 N
- 259 Bishop Place Unit 2-08
- 439 Bishop Place Unit 4-18
- 276 Bishop Place Unit 5-21
- 280 N West Temple
- 281 N Almond St
- 377 N Center St
- 424 N Center St Unit 301
- 480 N 300 W
- 275 W 500 N
- 438 N Center St Unit 304
- 260 W 500 N Unit 4
- 447 N Pugsley St
- 245 N Vine St Unit 903
- 245 N Vine St Unit 603
- 475 N Wall St
- 241 N Vine St Unit 802E
- 241 N Vine St Unit 507W
- 241 N Vine St Unit 1101E
- 241 N Vine St Unit 303W
- 333 N 200 W
- 345 N 200 W Unit 347
- 329 N 200 W
- 325 N 200 W
- 221 Ardmore Place
- 323 N 200 W Unit ST
- 323 N 200 W
- 355 N 200 W
- 237 Ardmore Place
- 224 Ardmore Place
- 309 N 200 W
- 363 N 200 W
- 328 N 200 W Unit 330
- 239 Ardmore Place
- 239 W Ardmore Place
- 367 N 200 W
- 204 W 300 N Unit 206
- 318 N 200 W
- 316 N 200 W
- 316 N 200 W