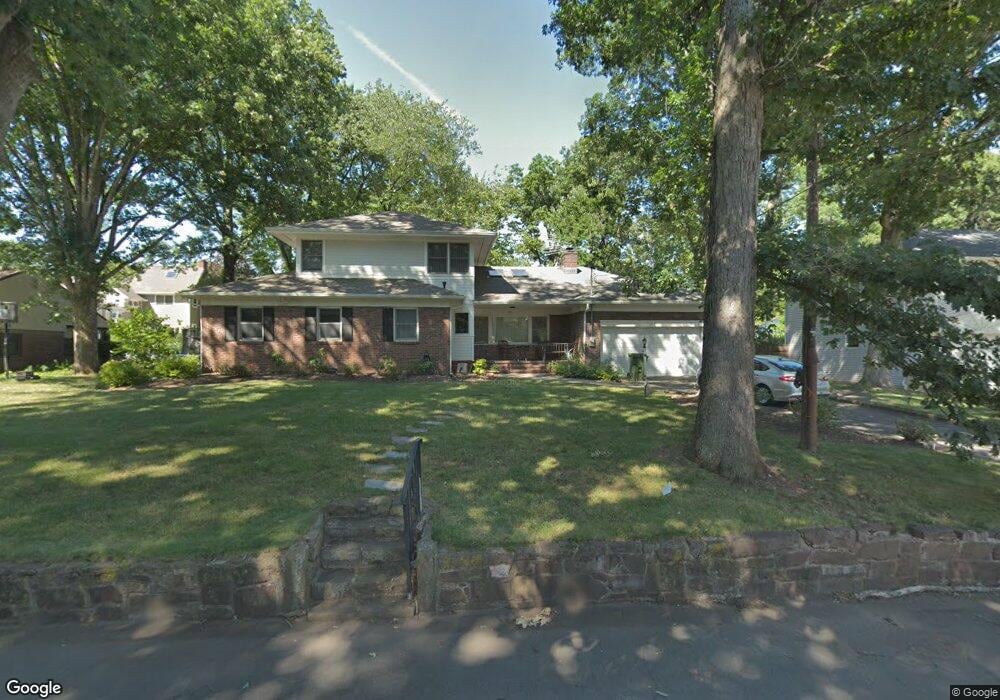
337 N Fifth Ave Edison, NJ 08817
Estimated Value: $870,705 - $1,329,000
--
Bed
--
Bath
2,814
Sq Ft
$388/Sq Ft
Est. Value
About This Home
This home is located at 337 N Fifth Ave, Edison, NJ 08817 and is currently estimated at $1,090,426, approximately $387 per square foot. 337 N Fifth Ave is a home located in Middlesex County with nearby schools including John Marshall Elementary School, Thomas Jefferson Middle School, and Edison High School.
Ownership History
Date
Name
Owned For
Owner Type
Purchase Details
Closed on
Aug 7, 2025
Sold by
Minsky Shulamith and Minsky Naftaly
Bought by
Liff Andrew and Klerer Tehila
Current Estimated Value
Purchase Details
Closed on
Apr 6, 1998
Sold by
Colton Michael
Bought by
Minsky Naftaly and Minsky Shula
Home Financials for this Owner
Home Financials are based on the most recent Mortgage that was taken out on this home.
Original Mortgage
$227,000
Interest Rate
7.12%
Create a Home Valuation Report for This Property
The Home Valuation Report is an in-depth analysis detailing your home's value as well as a comparison with similar homes in the area
Home Values in the Area
Average Home Value in this Area
Purchase History
| Date | Buyer | Sale Price | Title Company |
|---|---|---|---|
| Liff Andrew | $865,000 | North Star Title Agency | |
| Minsky Naftaly | $328,000 | -- |
Source: Public Records
Mortgage History
| Date | Status | Borrower | Loan Amount |
|---|---|---|---|
| Previous Owner | Minsky Naftaly | $227,000 |
Source: Public Records
Tax History Compared to Growth
Tax History
| Year | Tax Paid | Tax Assessment Tax Assessment Total Assessment is a certain percentage of the fair market value that is determined by local assessors to be the total taxable value of land and additions on the property. | Land | Improvement |
|---|---|---|---|---|
| 2025 | $21,062 | $353,800 | $146,200 | $207,600 |
| 2024 | $20,949 | $353,800 | $146,200 | $207,600 |
| 2023 | $20,949 | $353,800 | $146,200 | $207,600 |
| 2022 | $20,956 | $353,800 | $146,200 | $207,600 |
| 2021 | $20,885 | $353,800 | $146,200 | $207,600 |
| 2020 | $20,694 | $353,800 | $146,200 | $207,600 |
| 2019 | $14,975 | $353,800 | $146,200 | $207,600 |
| 2018 | $18,988 | $353,800 | $146,200 | $207,600 |
| 2017 | $18,988 | $353,800 | $146,200 | $207,600 |
| 2016 | $18,666 | $353,800 | $146,200 | $207,600 |
| 2015 | $17,952 | $353,800 | $146,200 | $207,600 |
| 2014 | $17,428 | $353,800 | $146,200 | $207,600 |
Source: Public Records
Map
Nearby Homes