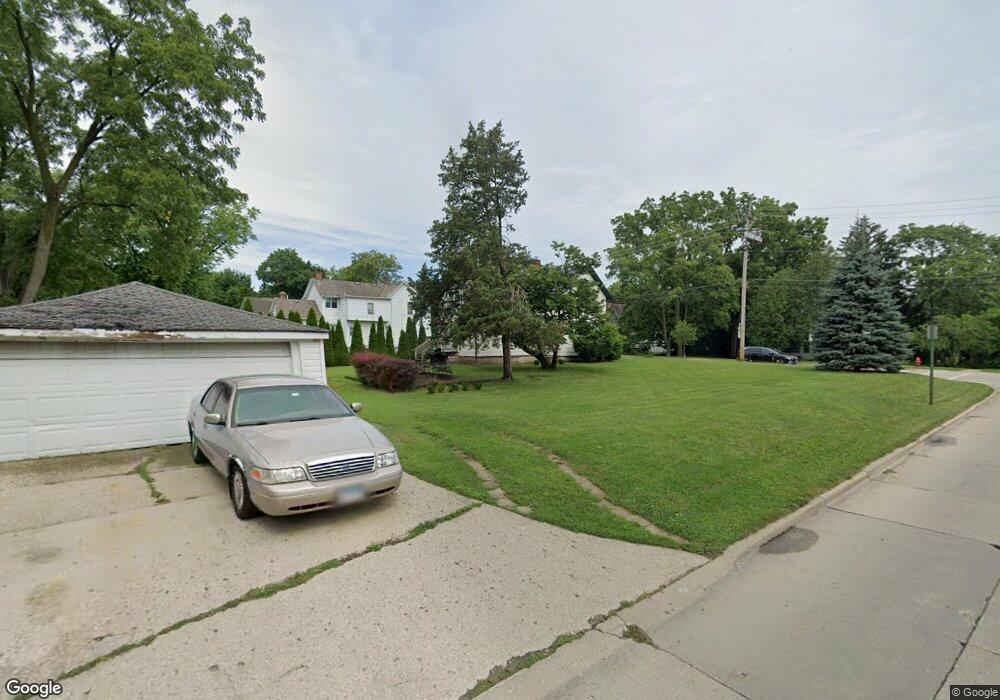
337 North Ave Libertyville, IL 60048
Estimated Value: $377,000 - $444,111
3
Beds
1
Bath
1,136
Sq Ft
$362/Sq Ft
Est. Value
About This Home
This home is located at 337 North Ave, Libertyville, IL 60048 and is currently estimated at $411,028, approximately $361 per square foot. 337 North Ave is a home located in Lake County with nearby schools including Butterfield School, Highland Middle School, and Libertyville High School.
Ownership History
Date
Name
Owned For
Owner Type
Purchase Details
Closed on
Sep 24, 2021
Sold by
Cappelle Austin W and Centerville Best Llc
Bought by
Cappelle Austin W
Current Estimated Value
Home Financials for this Owner
Home Financials are based on the most recent Mortgage that was taken out on this home.
Original Mortgage
$240,000
Outstanding Balance
$184,590
Interest Rate
2.15%
Mortgage Type
New Conventional
Estimated Equity
$226,438
Purchase Details
Closed on
Feb 19, 2014
Sold by
Cappelle Christine M
Bought by
Centerville Best Llc
Purchase Details
Closed on
Nov 1, 2004
Sold by
Madole George R and Madole Martha G
Bought by
Cappelle Austin W and Cappelle Christine M
Purchase Details
Closed on
May 3, 2001
Sold by
Madole William A and Madole Myrle E
Bought by
Madole George R and Madole Martha G
Home Financials for this Owner
Home Financials are based on the most recent Mortgage that was taken out on this home.
Original Mortgage
$75,000
Interest Rate
7.23%
Create a Home Valuation Report for This Property
The Home Valuation Report is an in-depth analysis detailing your home's value as well as a comparison with similar homes in the area
Home Values in the Area
Average Home Value in this Area
Purchase History
| Date | Buyer | Sale Price | Title Company |
|---|---|---|---|
| Cappelle Austin W | $147,000 | Mortgage Information Svcs | |
| Centerville Best Llc | -- | None Available | |
| Cappelle Austin W | $280,000 | Multiple | |
| Madole George R | $100,000 | Chicago Title Insurance Co |
Source: Public Records
Mortgage History
| Date | Status | Borrower | Loan Amount |
|---|---|---|---|
| Open | Cappelle Austin W | $240,000 | |
| Previous Owner | Madole George R | $75,000 |
Source: Public Records
Tax History Compared to Growth
Tax History
| Year | Tax Paid | Tax Assessment Tax Assessment Total Assessment is a certain percentage of the fair market value that is determined by local assessors to be the total taxable value of land and additions on the property. | Land | Improvement |
|---|---|---|---|---|
| 2024 | $8,216 | $119,278 | $81,793 | $37,485 |
| 2023 | $7,982 | $110,015 | $75,441 | $34,574 |
| 2022 | $7,982 | $105,808 | $72,512 | $33,296 |
| 2021 | $8,154 | $103,530 | $70,951 | $32,579 |
| 2020 | $7,852 | $101,789 | $69,758 | $32,031 |
| 2019 | $7,656 | $100,821 | $69,095 | $31,726 |
| 2018 | $6,901 | $93,886 | $71,876 | $22,010 |
| 2017 | $6,809 | $90,922 | $69,607 | $21,315 |
| 2016 | $6,597 | $86,207 | $65,997 | $20,210 |
| 2015 | $6,557 | $83,810 | $61,685 | $22,125 |
| 2014 | $5,994 | $76,560 | $56,349 | $20,211 |
| 2012 | $5,798 | $78,801 | $57,998 | $20,803 |
Source: Public Records
Map
Nearby Homes
- 224 Newberry Ave
- 217 E Church St
- 601 Broadway St
- 121 4th St
- 112 3rd St
- 922 N Milwaukee Ave Unit A
- 212 Elm Ct
- 1211 Parliament Ct
- 505 Lange Ct
- 420 W Cook Ave
- 204 W Ellis Ave
- 208 W Ellis Ave
- 212 W Ellis Ave
- 1754 Glenmore Rd
- 401 S 4th Ave
- 308 Mckinley Ave
- 426 S Milwaukee Ave
- 785 Meadow Ln
- 619 Parkside Ct
- 616 Parkside Ct