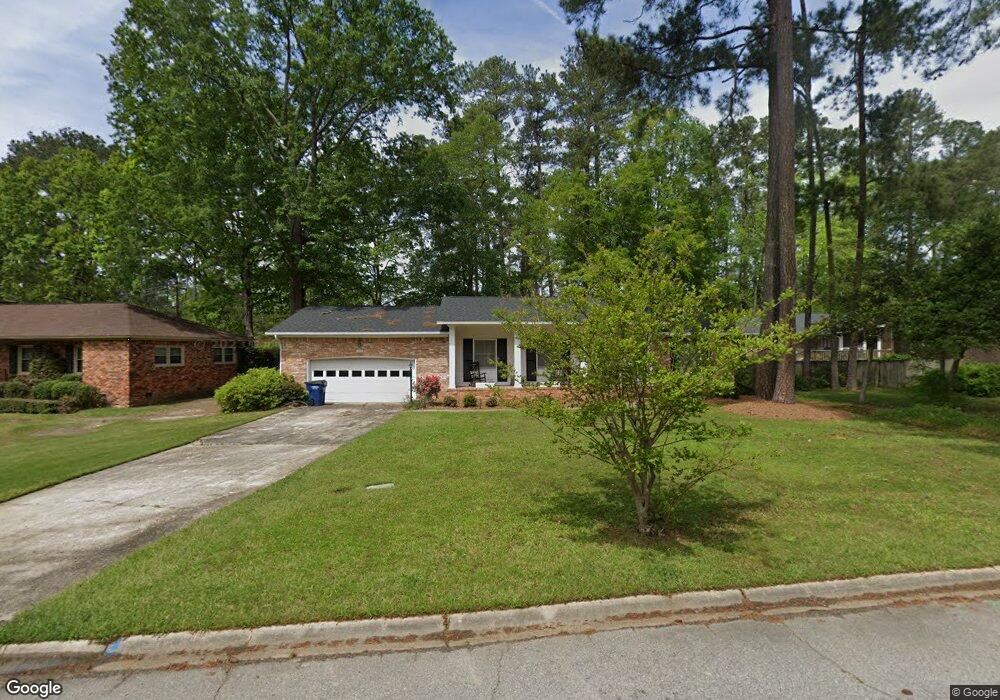
337 Shareditch Rd Columbia, SC 29210
Seven Oaks NeighborhoodEstimated Value: $248,387 - $285,000
3
Beds
2
Baths
1,750
Sq Ft
$151/Sq Ft
Est. Value
About This Home
This home is located at 337 Shareditch Rd, Columbia, SC 29210 and is currently estimated at $265,097, approximately $151 per square foot. 337 Shareditch Rd is a home located in Lexington County with nearby schools including Leaphart Elementary School, Irmo Middle, and Irmo High.
Ownership History
Date
Name
Owned For
Owner Type
Purchase Details
Closed on
Jul 3, 2024
Sold by
Mcgehee James C and Mcgehee Karl Lynn
Bought by
Hummel Clarissa and Workman Devon L
Current Estimated Value
Home Financials for this Owner
Home Financials are based on the most recent Mortgage that was taken out on this home.
Original Mortgage
$227,900
Outstanding Balance
$225,152
Interest Rate
6.94%
Mortgage Type
New Conventional
Estimated Equity
$39,945
Purchase Details
Closed on
Feb 16, 2011
Sold by
Estate Of Rebecca P Mcgehee and Mcgehee James C
Bought by
Mcgehee James C
Purchase Details
Closed on
Nov 8, 2007
Sold by
Mcgehee James C and Mcgehee Rebecca P
Bought by
Karl Lynn Mcghee
Purchase Details
Closed on
Nov 9, 2006
Sold by
Mathers Grace P
Bought by
Mcgehee James C and Mcgehee Rebecca P
Home Financials for this Owner
Home Financials are based on the most recent Mortgage that was taken out on this home.
Original Mortgage
$70,000
Interest Rate
5.96%
Mortgage Type
New Conventional
Create a Home Valuation Report for This Property
The Home Valuation Report is an in-depth analysis detailing your home's value as well as a comparison with similar homes in the area
Home Values in the Area
Average Home Value in this Area
Purchase History
| Date | Buyer | Sale Price | Title Company |
|---|---|---|---|
| Hummel Clarissa | $247,900 | None Listed On Document | |
| Mcgehee James C | -- | -- | |
| Karl Lynn Mcghee | -- | None Available | |
| Mcgehee James C | $140,000 | None Available |
Source: Public Records
Mortgage History
| Date | Status | Borrower | Loan Amount |
|---|---|---|---|
| Open | Hummel Clarissa | $227,900 | |
| Previous Owner | Mcgehee James C | $70,000 |
Source: Public Records
Tax History
| Year | Tax Paid | Tax Assessment Tax Assessment Total Assessment is a certain percentage of the fair market value that is determined by local assessors to be the total taxable value of land and additions on the property. | Land | Improvement |
|---|---|---|---|---|
| 2024 | $1,427 | $5,301 | $1,273 | $4,028 |
| 2023 | $812 | $5,301 | $1,273 | $4,028 |
| 2022 | $829 | $5,301 | $1,273 | $4,028 |
| 2020 | $863 | $5,301 | $1,273 | $4,028 |
| 2019 | $766 | $4,609 | $1,200 | $3,409 |
| 2018 | $673 | $4,609 | $1,200 | $3,409 |
| 2017 | $655 | $4,609 | $1,200 | $3,409 |
| 2016 | $673 | $4,608 | $1,200 | $3,408 |
| 2014 | $770 | $5,234 | $1,150 | $4,084 |
| 2013 | -- | $5,240 | $1,150 | $4,090 |
Source: Public Records
Map
Nearby Homes
- 230 Shareditch Rd
- 443 Pittsdowne Rd
- 736 Shadowbrook Dr
- 219 Ambling Cir
- 130 Wilkshire Dr
- 249 Sandhurst Rd
- 412 Winstaire Dr
- 306 Tartan Rd
- 316 Tartan Rd
- 320 Tartan Rd
- 113 Chippenham Cir
- 326 Tartan Rd
- 234 Vincenne Rd
- 3700 Bush River Rd Unit H5
- 3700 Bush River Rd Unit J8
- 3700 Bush River Rd Unit K-3
- 3700 Bush River Rd Unit I3
- 3700 Bush River Rd Unit F2
- 107 Southwell Rd
- 207 Baymore Ln
- 1-6 Shadowbrook Dr
- 331 Shareditch Rd
- 519 Old Friars Rd
- 325 Shareditch Rd
- 332 Townes Rd
- 342 Shareditch Rd
- 338 Townes Rd
- 336 Shareditch Rd
- 330 Shareditch Rd
- 326 Townes Rd
- 319 Shareditch Rd
- 324 Shareditch Rd
- 507 Old Friars Rd
- 524 Old Friars Rd
- 518 Old Friars Rd
- 320 Townes Rd
- 512 Old Friars Rd
- 400 Townes Rd
- 318 Shareditch Rd
- 339 Townes Rd
Your Personal Tour Guide
Ask me questions while you tour the home.