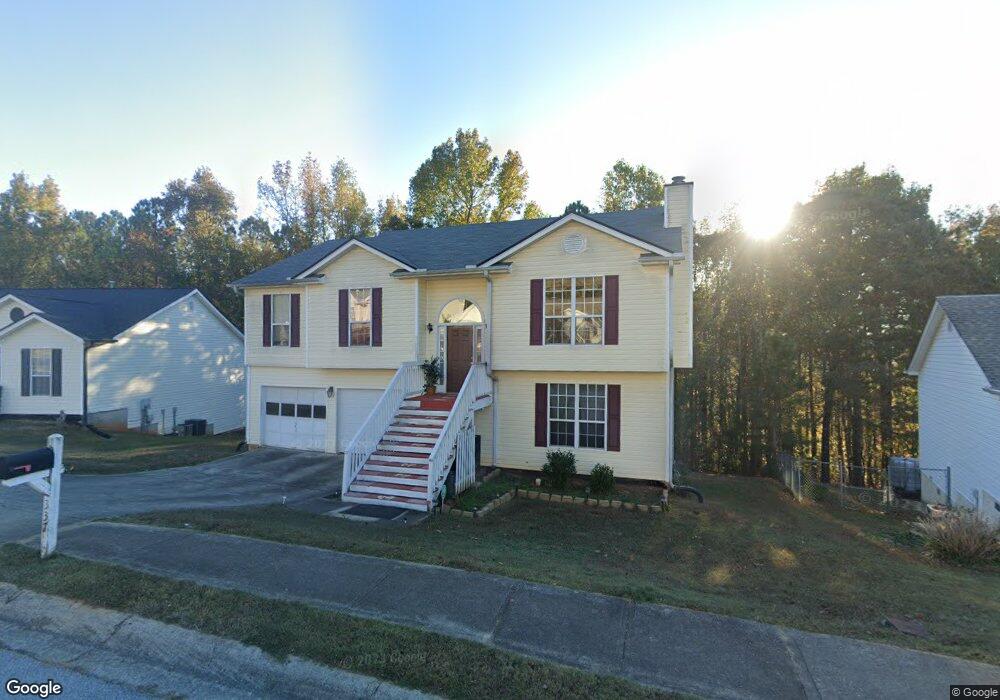
337 Shoal Cir Unit 5 Lawrenceville, GA 30046
Estimated Value: $345,383 - $420,000
3
Beds
2
Baths
1,595
Sq Ft
$233/Sq Ft
Est. Value
About This Home
This home is located at 337 Shoal Cir Unit 5, Lawrenceville, GA 30046 and is currently estimated at $372,346, approximately $233 per square foot. 337 Shoal Cir Unit 5 is a home located in Gwinnett County with nearby schools including Jenkins Elementary School, Jordan Middle School, and Central Gwinnett High School.
Ownership History
Date
Name
Owned For
Owner Type
Purchase Details
Closed on
Mar 23, 2015
Sold by
Luy Ranette
Bought by
Mohammed Mensur
Current Estimated Value
Home Financials for this Owner
Home Financials are based on the most recent Mortgage that was taken out on this home.
Original Mortgage
$132,783
Outstanding Balance
$104,331
Interest Rate
4.4%
Mortgage Type
FHA
Estimated Equity
$268,015
Purchase Details
Closed on
Aug 24, 2009
Sold by
Hud-Housing Of Urban Dev
Bought by
Luy Ranette
Purchase Details
Closed on
Dec 2, 2008
Sold by
Midfirst Bk
Bought by
Hud-Housing Of Urban Dev
Purchase Details
Closed on
Jun 14, 2000
Sold by
Starcraft Properties Inc
Bought by
Hernandez Sonia
Home Financials for this Owner
Home Financials are based on the most recent Mortgage that was taken out on this home.
Original Mortgage
$145,973
Interest Rate
8.27%
Mortgage Type
FHA
Create a Home Valuation Report for This Property
The Home Valuation Report is an in-depth analysis detailing your home's value as well as a comparison with similar homes in the area
Home Values in the Area
Average Home Value in this Area
Purchase History
| Date | Buyer | Sale Price | Title Company |
|---|---|---|---|
| Mohammed Mensur | $145,000 | -- | |
| Luy Ranette | -- | -- | |
| Hud-Housing Of Urban Dev | -- | -- | |
| Midfirst Bk | $188,088 | -- | |
| Hernandez Sonia | $147,900 | -- |
Source: Public Records
Mortgage History
| Date | Status | Borrower | Loan Amount |
|---|---|---|---|
| Open | Mohammed Mensur | $132,783 | |
| Previous Owner | Hernandez Sonia | $145,973 |
Source: Public Records
Tax History Compared to Growth
Tax History
| Year | Tax Paid | Tax Assessment Tax Assessment Total Assessment is a certain percentage of the fair market value that is determined by local assessors to be the total taxable value of land and additions on the property. | Land | Improvement |
|---|---|---|---|---|
| 2024 | $4,077 | $127,400 | $22,000 | $105,400 |
| 2023 | $4,077 | $127,400 | $22,000 | $105,400 |
| 2022 | $4,090 | $127,400 | $22,000 | $105,400 |
| 2021 | $3,359 | $102,400 | $17,600 | $84,800 |
| 2020 | $3,015 | $84,720 | $12,800 | $71,920 |
| 2019 | $2,751 | $77,360 | $12,800 | $64,560 |
| 2018 | $2,533 | $72,520 | $12,800 | $59,720 |
| 2016 | $2,035 | $58,000 | $10,800 | $47,200 |
| 2015 | $1,449 | $40,760 | $6,000 | $34,760 |
| 2014 | -- | $40,760 | $6,000 | $34,760 |
Source: Public Records
Map
Nearby Homes
- 605 Saddle Shoals Dr
- 354 Shoal Ct
- 494 Saddle Shoal Trail
- 443 Marsh Lake Rd
- 248 Springbottom Dr
- 695 Josh Ln
- 344 Springbottom Ct
- 364 Springhaven Way
- 875 Josh Ln
- 605 Ashland Park Way Unit 1
- 785 Josh Ln
- 395 Paper Mill Dr Unit 1
- 240 Ashland Manor Dr Unit 1
- 480 Pond Weed Dr
- 690 Springlake Rd
- 304 Cool Weather Dr
- 1045 Paper Creek Dr
- 337 Shoal Cir
- 327 Shoal Cir Unit 5
- 347 Shoal Cir
- 357 Shoal Cir
- 357 Shoal Cir Unit 18
- 317 Shoal Cir Unit 5
- 322 Shoal Cir
- 342 Shoal Cir Unit 5
- 352 Shoal Cir Unit V
- 367 Shoal Cir
- 302 Shoal Cir
- 302 Shoal Cir Unit 1
- 307 Shoal Cir
- 362 Shoal Cir Unit 5
- 555 Saddle Shoals Dr
- 377 Shoal Cir
- 505 Saddle Shoals Dr
- 372 Shoal Cir
- 495 Saddle Shoals Dr
- 319 Shoal Ct Unit 2