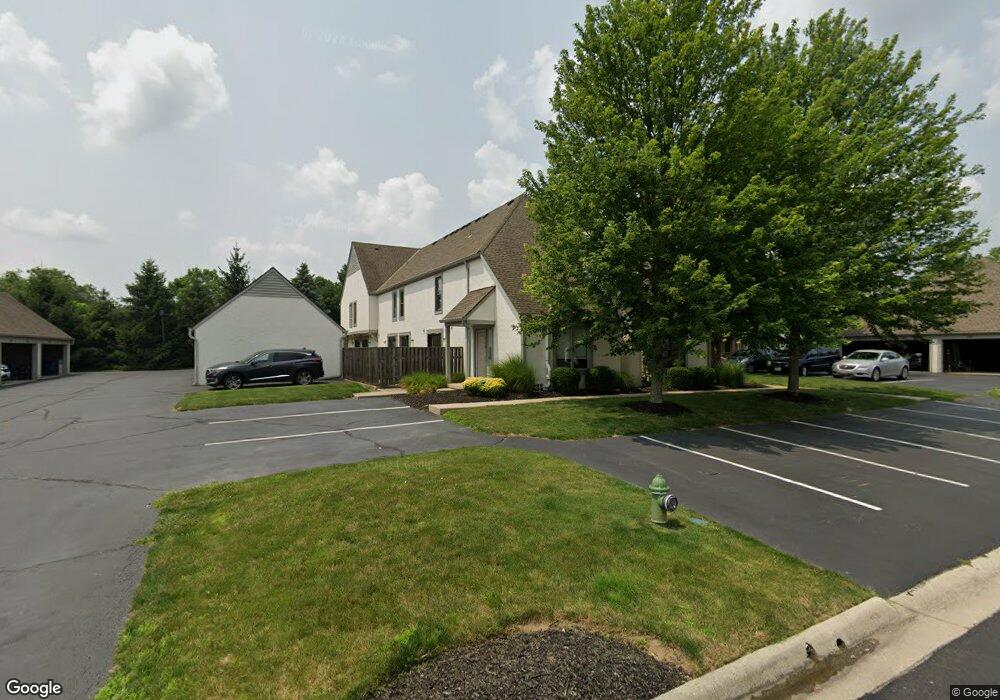
337 St Andrews Dr Dublin, OH 43017
Estimated Value: $183,000 - $227,000
1
Bed
2
Baths
816
Sq Ft
$260/Sq Ft
Est. Value
About This Home
This home is located at 337 St Andrews Dr, Dublin, OH 43017 and is currently estimated at $212,431, approximately $260 per square foot. 337 St Andrews Dr is a home located in Franklin County with nearby schools including Indian Run Elementary School, John Sells Middle School, and Dublin Coffman High School.
Ownership History
Date
Name
Owned For
Owner Type
Purchase Details
Closed on
Sep 26, 2016
Sold by
Wynn Mary A
Bought by
Williams Jeffrey A
Current Estimated Value
Home Financials for this Owner
Home Financials are based on the most recent Mortgage that was taken out on this home.
Original Mortgage
$90,250
Interest Rate
3.25%
Mortgage Type
Adjustable Rate Mortgage/ARM
Purchase Details
Closed on
May 2, 2013
Sold by
Condominium Equity Group Llc
Bought by
Wynn Mary A
Home Financials for this Owner
Home Financials are based on the most recent Mortgage that was taken out on this home.
Original Mortgage
$25,500
Interest Rate
2.7%
Mortgage Type
New Conventional
Purchase Details
Closed on
Aug 31, 2008
Sold by
Pgw Investment Llc
Bought by
Condominium Equity Group Llc
Purchase Details
Closed on
Dec 7, 2006
Sold by
Saint Andrews Investors Ltd Iii
Bought by
Pgw Investment Llc
Home Financials for this Owner
Home Financials are based on the most recent Mortgage that was taken out on this home.
Original Mortgage
$3,515,600
Interest Rate
6.36%
Mortgage Type
Purchase Money Mortgage
Create a Home Valuation Report for This Property
The Home Valuation Report is an in-depth analysis detailing your home's value as well as a comparison with similar homes in the area
Home Values in the Area
Average Home Value in this Area
Purchase History
| Date | Buyer | Sale Price | Title Company |
|---|---|---|---|
| Williams Jeffrey A | $95,000 | Title First Agency Inc | |
| Wynn Mary A | $80,500 | None Available | |
| Condominium Equity Group Llc | -- | Attorney | |
| Pgw Investment Llc | $3,740,000 | Chicago Tit |
Source: Public Records
Mortgage History
| Date | Status | Borrower | Loan Amount |
|---|---|---|---|
| Previous Owner | Williams Jeffrey A | $90,250 | |
| Previous Owner | Wynn Mary A | $25,500 | |
| Previous Owner | Pgw Investment Llc | $3,515,600 |
Source: Public Records
Tax History Compared to Growth
Tax History
| Year | Tax Paid | Tax Assessment Tax Assessment Total Assessment is a certain percentage of the fair market value that is determined by local assessors to be the total taxable value of land and additions on the property. | Land | Improvement |
|---|---|---|---|---|
| 2024 | $4,366 | $67,200 | $15,750 | $51,450 |
| 2023 | $4,305 | $67,200 | $15,750 | $51,450 |
| 2022 | $2,873 | $40,990 | $7,110 | $33,880 |
| 2021 | $2,880 | $40,990 | $7,110 | $33,880 |
| 2020 | $2,904 | $40,990 | $7,110 | $33,880 |
| 2019 | $2,265 | $28,280 | $4,900 | $23,380 |
| 2018 | $2,263 | $28,280 | $4,900 | $23,380 |
| 2017 | $2,173 | $28,280 | $4,900 | $23,380 |
| 2016 | $2,237 | $28,180 | $5,150 | $23,030 |
| 2015 | $2,252 | $28,180 | $5,150 | $23,030 |
| 2014 | $2,254 | $28,180 | $5,150 | $23,030 |
| 2013 | $1,609 | $38,430 | $5,145 | $33,285 |
Source: Public Records
Map
Nearby Homes
- 302 Saint Andrews Dr Unit 302
- 342 Saint Andrews Dr Unit 342
- 416 Edinburgh Rd
- 372 Edinburgh Rd
- 390 Edinburgh Rd
- 412 Edinburgh Rd
- 6350 Frantz Rd
- 5830 Settlers Place
- 6052 Dublin Rd
- 6527 Quarry Ln
- 5850 Chatterfield Dr
- 143 S Riverview St
- 6383 Dummerston Ct
- 3334 Edgebrook Dr
- 6549 Brock St
- 6730 Dublin Rd
- 6241 Buck Ridge Rd
- 6187 Water Bank St
- 3263 Scioto Ridge Rd
- 7154 Drummore Ct
- 335 Saint Andrews Dr Unit 355
- 335 St Andrews Dr
- 337 Saint Andrews Dr Unit 337
- 339 Saint Andrews Dr Unit 339
- 343 Saint Andrews Dr Unit 343
- 341 Saint Andrews Dr
- 333 Saint Andrews Dr Unit 333
- 345 Saint Andrews Dr Unit 345
- 333 St Andrews Dr
- 331 Saint Andrews Dr Unit 331
- 331 St Andrews Dr
- 329 Saint Andrews Dr Unit 329
- 0 Saint Andrews Dr
- 327 Saint Andrews Dr Unit 327
- 359 Saint Andrews Dr Unit 359
- 363 Saint Andrews Dr Unit 363
- 357 Saint Andrews Dr Unit 357
- 325 Saint Andrews Dr Unit 325
- 325 St Andrews Dr
- 334 Saint Andrews Dr Unit 334