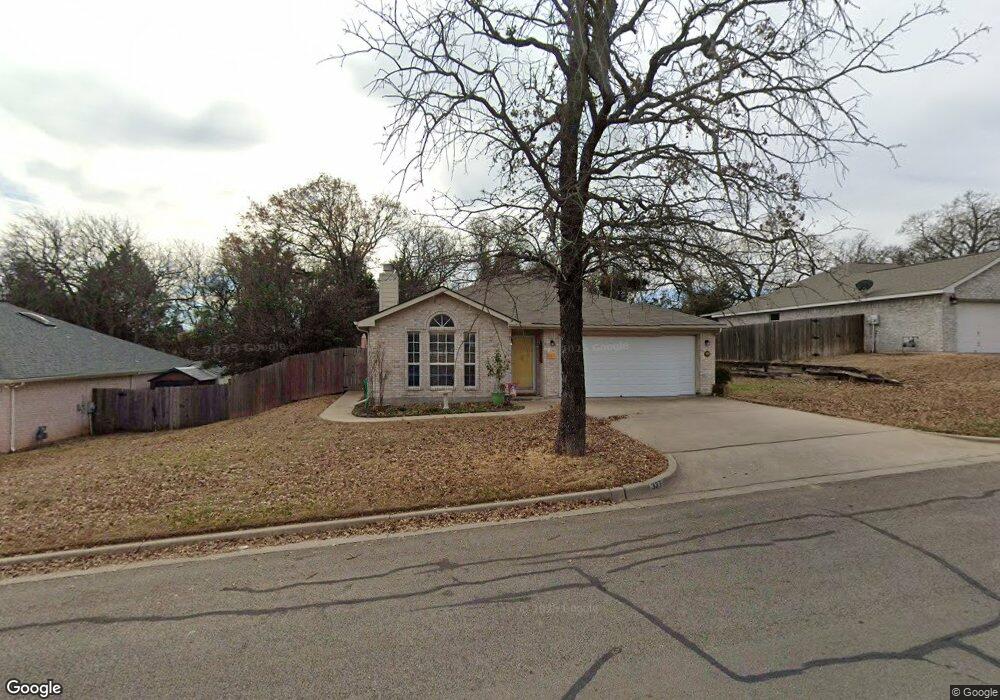
337 Sweetwater Dr Weatherford, TX 76086
Estimated Value: $281,056 - $298,000
3
Beds
2
Baths
1,433
Sq Ft
$202/Sq Ft
Est. Value
About This Home
This home is located at 337 Sweetwater Dr, Weatherford, TX 76086 and is currently estimated at $288,764, approximately $201 per square foot. 337 Sweetwater Dr is a home located in Parker County with nearby schools including Crockett Elementary School, Tison Middle School, and Weatherford High School.
Ownership History
Date
Name
Owned For
Owner Type
Purchase Details
Closed on
May 26, 2016
Sold by
Johnson James D and Johnson James Donovan
Bought by
Smith Sandy W
Current Estimated Value
Purchase Details
Closed on
Aug 6, 2012
Sold by
Johnson Aimee Renee
Bought by
Johnson James Donovan
Purchase Details
Closed on
Mar 22, 2007
Sold by
Cobb Staci L
Bought by
Smith Sandy W
Home Financials for this Owner
Home Financials are based on the most recent Mortgage that was taken out on this home.
Original Mortgage
$112,500
Interest Rate
6.26%
Mortgage Type
New Conventional
Purchase Details
Closed on
Apr 9, 2001
Sold by
Choice Homes Inc
Bought by
Smith Sandy W
Purchase Details
Closed on
Jan 16, 2001
Sold by
Sweetwater Land & Cattle Co Lt
Bought by
Smith Sandy W
Create a Home Valuation Report for This Property
The Home Valuation Report is an in-depth analysis detailing your home's value as well as a comparison with similar homes in the area
Home Values in the Area
Average Home Value in this Area
Purchase History
| Date | Buyer | Sale Price | Title Company |
|---|---|---|---|
| Smith Sandy W | -- | Providence Title Company | |
| Johnson James Donovan | -- | None Available | |
| Smith Sandy W | -- | -- | |
| Johnson James D | -- | Fatco | |
| Smith Sandy W | -- | -- | |
| Smith Sandy W | -- | -- |
Source: Public Records
Mortgage History
| Date | Status | Borrower | Loan Amount |
|---|---|---|---|
| Previous Owner | Johnson James D | $112,500 |
Source: Public Records
Tax History Compared to Growth
Tax History
| Year | Tax Paid | Tax Assessment Tax Assessment Total Assessment is a certain percentage of the fair market value that is determined by local assessors to be the total taxable value of land and additions on the property. | Land | Improvement |
|---|---|---|---|---|
| 2025 | $1,305 | $254,536 | -- | -- |
| 2024 | $1,305 | $231,396 | -- | -- |
| 2023 | $1,305 | $210,360 | $0 | $0 |
| 2022 | $4,242 | $191,240 | $20,000 | $171,240 |
| 2021 | $4,409 | $191,240 | $20,000 | $171,240 |
| 2020 | $4,033 | $166,910 | $20,000 | $146,910 |
| 2019 | $3,902 | $166,910 | $20,000 | $146,910 |
| 2018 | $3,563 | $138,920 | $20,000 | $118,920 |
| 2017 | $3,655 | $138,920 | $20,000 | $118,920 |
| 2016 | $3,156 | $119,960 | $20,000 | $99,960 |
| 2015 | $2,635 | $119,960 | $20,000 | $99,960 |
| 2014 | $2,452 | $105,990 | $20,000 | $85,990 |
Source: Public Records
Map
Nearby Homes
- 509 Sweetwater Dr
- 522 Crow Ave
- Horseshoe Bend Rd
- 0 Adell Cir
- 1609 Dicey Rd
- 107 Hickory Ln
- 110 Pine St
- The Chisholm Plan at Hickory Place Addition
- 305 Hickory Ln
- 214 Cedar St
- 307 Hickory Ln
- 228 Allen St
- 905 Terry Trail
- 249 Wandering Ln
- 101 Meadow Ct
- Lot 14 Clover Cir
- 1917 Windowmere Trail
- Lot 15 Clover Cir
- 309 De la Cruz St
- 313 De la Cruz St
- L28BA Sweetwater Dr
- 341 Sweetwater Dr
- 338 Sweetwater Dr
- 302 Pecos Dr
- 329 Sweetwater Dr
- 334 Sweetwater Dr
- 345 Sweetwater Dr
- 330 Sweetwater Dr
- 325 Sweetwater Dr
- 306 Pecos Dr
- 301 Pecos Dr
- 349 Sweetwater Dr
- 326 Sweetwater Dr
- 329 Alpine Dr
- 310 Pecos Dr
- 321 Sweetwater Dr
- 333 Alpine Dr
- 305 Pecos Dr
- 322 Sweetwater Dr
- 401 Sweetwater Dr