Estimated Value: $267,753 - $301,000
2
Beds
2
Baths
1,024
Sq Ft
$276/Sq Ft
Est. Value
About This Home
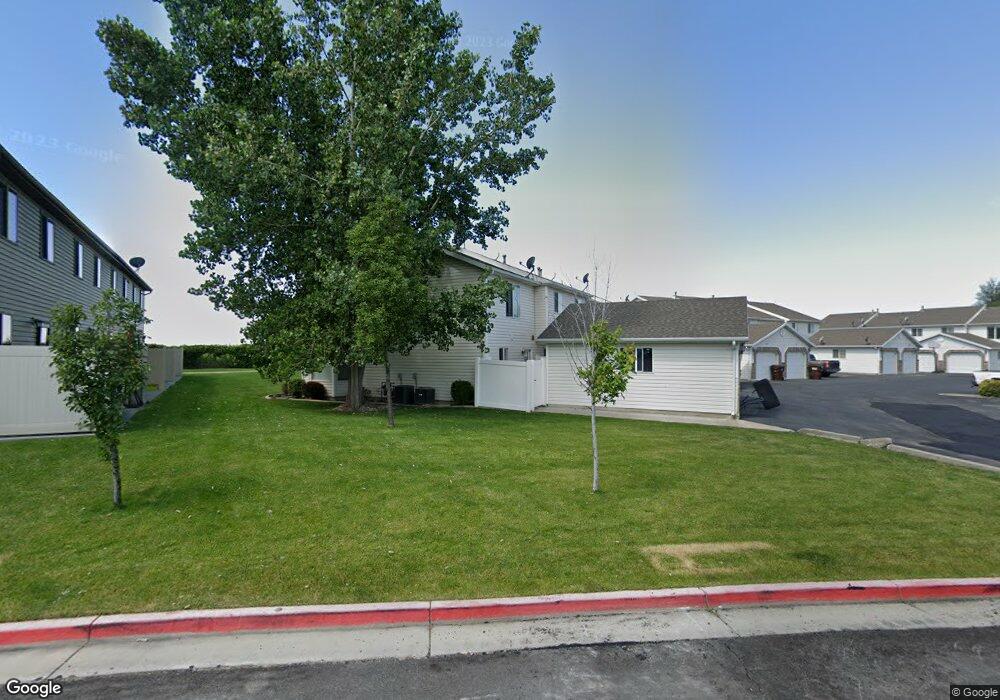
This home is located at 337 W 1925 N, Ogden, UT 84414 and is currently estimated at $282,188, approximately $275 per square foot. 337 W 1925 N is a home located in Weber County with nearby schools including Majestic Elementary School, Orion Junior High School, and Fremont High School.
Ownership History
Date
Name
Owned For
Owner Type
Purchase Details
Closed on
Jul 8, 2019
Sold by
Arave Chase Kendal
Bought by
Rowley Christie
Current Estimated Value
Home Financials for this Owner
Home Financials are based on the most recent Mortgage that was taken out on this home.
Original Mortgage
$183,350
Outstanding Balance
$161,221
Interest Rate
4%
Mortgage Type
New Conventional
Estimated Equity
$120,967
Purchase Details
Closed on
Jan 11, 2019
Sold by
Marion Ron A
Bought by
Arave Chase Kendal
Home Financials for this Owner
Home Financials are based on the most recent Mortgage that was taken out on this home.
Original Mortgage
$164,957
Interest Rate
4.97%
Mortgage Type
FHA
Purchase Details
Closed on
Dec 4, 2007
Sold by
Mike Schultz Construction Inc
Bought by
Marion Ron A
Purchase Details
Closed on
Feb 19, 2004
Sold by
Golf Crest Village Llc
Bought by
Mike Schultz Construction Inc
Create a Home Valuation Report for This Property
The Home Valuation Report is an in-depth analysis detailing your home's value as well as a comparison with similar homes in the area
Home Values in the Area
Average Home Value in this Area
Purchase History
| Date | Buyer | Sale Price | Title Company |
|---|---|---|---|
| Rowley Christie | -- | Backman Ntp | |
| Arave Chase Kendal | -- | American Secure Title Logan | |
| Marion Ron A | -- | Heritage West Title Ins | |
| Mike Schultz Construction Inc | -- | -- |
Source: Public Records
Mortgage History
| Date | Status | Borrower | Loan Amount |
|---|---|---|---|
| Open | Rowley Christie | $183,350 | |
| Previous Owner | Arave Chase Kendal | $164,957 |
Source: Public Records
Tax History Compared to Growth
Tax History
| Year | Tax Paid | Tax Assessment Tax Assessment Total Assessment is a certain percentage of the fair market value that is determined by local assessors to be the total taxable value of land and additions on the property. | Land | Improvement |
|---|---|---|---|---|
| 2025 | $1,871 | $292,174 | $80,000 | $212,174 |
| 2024 | $1,806 | $157,849 | $44,000 | $113,849 |
| 2023 | $1,807 | $158,950 | $44,000 | $114,950 |
| 2022 | $1,746 | $156,199 | $44,000 | $112,199 |
| 2021 | $1,133 | $188,000 | $45,000 | $143,000 |
| 2020 | $1,126 | $173,000 | $30,000 | $143,000 |
| 2019 | $1,070 | $155,999 | $30,000 | $125,999 |
| 2018 | $1,017 | $142,001 | $23,000 | $119,001 |
| 2017 | $902 | $118,999 | $21,000 | $97,999 |
| 2016 | $809 | $57,750 | $11,550 | $46,200 |
| 2015 | $777 | $55,001 | $11,550 | $43,451 |
| 2014 | $672 | $46,750 | $11,550 | $35,200 |
Source: Public Records
Map
Nearby Homes
- 416 W 1925 N
- 1953 N 275 W Unit 13
- 1960 N 275 W Unit 29
- 1964 N 225 W
- 1743 N 400 W
- 180 W 1825 N
- 247 E 1825 N Unit 10
- 247 E 1825 N Unit 7
- 247 E 1825 N Unit 11
- 178 W 1750 N
- 2303 N 300 W
- 1272 N 350 W Unit 158
- 108 W 1875 N
- 2458 N Highway 89 Hwy
- 2205 N 700 W
- 2393 Wellington Dr
- 2474 N Dorchester Ave
- 2270 N 750 W
- 2434 Charleston Ave
- 157 Arlington Way