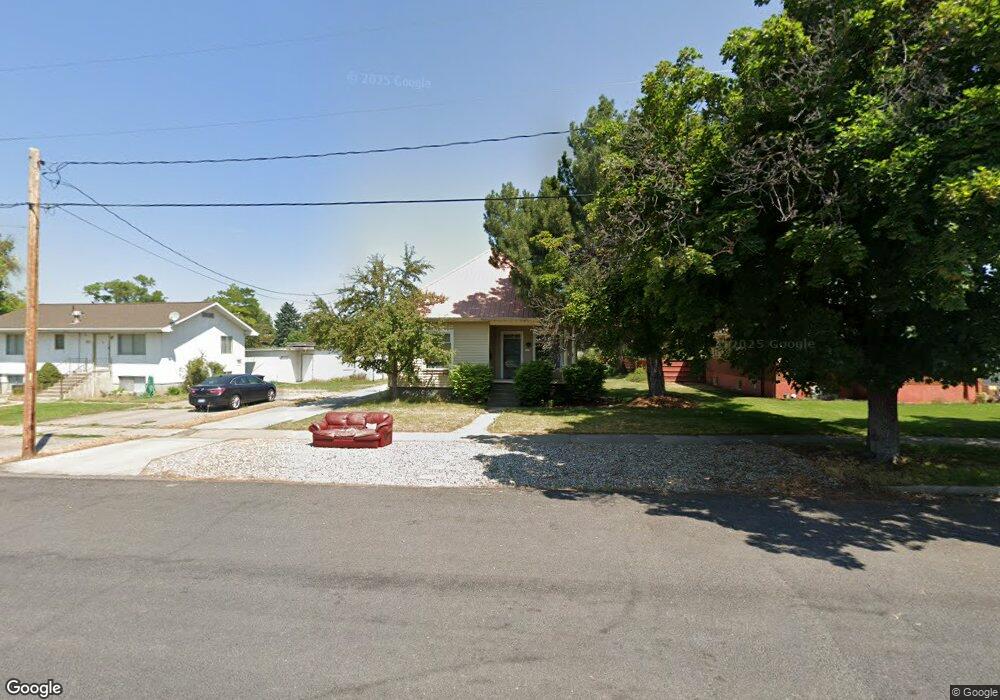
337 W 200 S Logan, UT 84321
Ellis NeighborhoodEstimated Value: $309,000 - $345,000
3
Beds
1
Bath
1,638
Sq Ft
$201/Sq Ft
Est. Value
About This Home
This home is located at 337 W 200 S, Logan, UT 84321 and is currently estimated at $328,477, approximately $200 per square foot. 337 W 200 S is a home located in Cache County with nearby schools including Ellis School, Mount Logan Middle School, and Logan High School.
Ownership History
Date
Name
Owned For
Owner Type
Purchase Details
Closed on
Sep 10, 2020
Sold by
Butler Ian
Bought by
Butler Ian S and Eastman Teagan
Current Estimated Value
Home Financials for this Owner
Home Financials are based on the most recent Mortgage that was taken out on this home.
Original Mortgage
$40,000
Outstanding Balance
$35,417
Interest Rate
2.9%
Mortgage Type
Credit Line Revolving
Estimated Equity
$293,060
Purchase Details
Closed on
Mar 7, 2013
Sold by
Walk Robert and Walk Theresa A
Bought by
Butler Ian
Home Financials for this Owner
Home Financials are based on the most recent Mortgage that was taken out on this home.
Original Mortgage
$125,370
Outstanding Balance
$87,658
Interest Rate
3.49%
Mortgage Type
New Conventional
Estimated Equity
$240,819
Create a Home Valuation Report for This Property
The Home Valuation Report is an in-depth analysis detailing your home's value as well as a comparison with similar homes in the area
Home Values in the Area
Average Home Value in this Area
Purchase History
| Date | Buyer | Sale Price | Title Company |
|---|---|---|---|
| Butler Ian S | -- | Cache Title Logan | |
| Butler Ian | -- | Heritage Title Ins Ag Inc Lo |
Source: Public Records
Mortgage History
| Date | Status | Borrower | Loan Amount |
|---|---|---|---|
| Open | Butler Ian S | $40,000 | |
| Open | Butler Ian | $125,370 |
Source: Public Records
Tax History
| Year | Tax Paid | Tax Assessment Tax Assessment Total Assessment is a certain percentage of the fair market value that is determined by local assessors to be the total taxable value of land and additions on the property. | Land | Improvement |
|---|---|---|---|---|
| 2025 | $1,324 | $171,255 | $0 | $0 |
| 2024 | $1,364 | $170,805 | $0 | $0 |
| 2023 | $1,425 | $170,130 | $0 | $0 |
| 2022 | $1,204 | $134,205 | $0 | $0 |
| 2021 | $1,081 | $186,289 | $42,000 | $144,289 |
| 2020 | $987 | $152,992 | $42,000 | $110,992 |
| 2019 | $1,031 | $152,992 | $42,000 | $110,992 |
| 2018 | $1,042 | $141,100 | $42,000 | $99,100 |
| 2017 | $928 | $66,440 | $0 | $0 |
| 2016 | $962 | $66,440 | $0 | $0 |
| 2015 | $963 | $66,440 | $0 | $0 |
| 2014 | $871 | $66,440 | $0 | $0 |
| 2013 | -- | $66,440 | $0 | $0 |
Source: Public Records
Map
Nearby Homes
Your Personal Tour Guide
Ask me questions while you tour the home.