337 Windermere Cir Edwards, CO 81632
Estimated Value: $4,382,000 - $5,261,000
5
Beds
5
Baths
3,727
Sq Ft
$1,317/Sq Ft
Est. Value
About This Home
This home is located at 337 Windermere Cir, Edwards, CO 81632 and is currently estimated at $4,907,641, approximately $1,316 per square foot. 337 Windermere Cir is a home located in Eagle County with nearby schools including Edwards Early Learning Center, Berry Creek Middle School, and Battle Mountain High School.
Ownership History
Date
Name
Owned For
Owner Type
Purchase Details
Closed on
Jun 24, 2020
Sold by
Bailey John M and Bailey Patricia S
Bought by
Windemere Kbt Llc
Current Estimated Value
Purchase Details
Closed on
Mar 17, 2010
Sold by
Bailey Patricia S
Bought by
Bailey Patricia S and Bailey John M
Home Financials for this Owner
Home Financials are based on the most recent Mortgage that was taken out on this home.
Original Mortgage
$999,999
Interest Rate
5.5%
Mortgage Type
New Conventional
Purchase Details
Closed on
Sep 8, 2006
Sold by
Robertson Dennis B and Robertson Sally S
Bought by
Bailey Patricia S
Home Financials for this Owner
Home Financials are based on the most recent Mortgage that was taken out on this home.
Original Mortgage
$1,300,000
Interest Rate
6.25%
Mortgage Type
Purchase Money Mortgage
Purchase Details
Closed on
Mar 29, 1995
Purchase Details
Closed on
Aug 9, 1993
Create a Home Valuation Report for This Property
The Home Valuation Report is an in-depth analysis detailing your home's value as well as a comparison with similar homes in the area
Home Values in the Area
Average Home Value in this Area
Purchase History
| Date | Buyer | Sale Price | Title Company |
|---|---|---|---|
| Windemere Kbt Llc | -- | None Available | |
| Bailey Patricia S | -- | None Available | |
| Bailey Patricia S | $1,975,000 | Land Title Guarantee Company | |
| -- | $647,500 | -- | |
| -- | $55,000 | -- |
Source: Public Records
Mortgage History
| Date | Status | Borrower | Loan Amount |
|---|---|---|---|
| Previous Owner | Bailey Patricia S | $999,999 | |
| Previous Owner | Bailey Patricia S | $1,300,000 |
Source: Public Records
Tax History Compared to Growth
Tax History
| Year | Tax Paid | Tax Assessment Tax Assessment Total Assessment is a certain percentage of the fair market value that is determined by local assessors to be the total taxable value of land and additions on the property. | Land | Improvement |
|---|---|---|---|---|
| 2024 | $13,681 | $249,780 | $39,620 | $210,160 |
| 2023 | $13,681 | $249,780 | $39,620 | $210,160 |
| 2022 | $10,246 | $148,440 | $36,140 | $112,300 |
| 2021 | $10,409 | $152,710 | $37,180 | $115,530 |
| 2020 | $10,908 | $154,960 | $33,960 | $121,000 |
| 2019 | $10,857 | $154,960 | $33,960 | $121,000 |
| 2018 | $10,838 | $148,620 | $32,400 | $116,220 |
| 2017 | $10,747 | $148,620 | $32,400 | $116,220 |
| 2016 | $9,494 | $130,860 | $35,820 | $95,040 |
| 2015 | -- | $130,860 | $35,820 | $95,040 |
| 2014 | $8,235 | $124,060 | $47,760 | $76,300 |
Source: Public Records
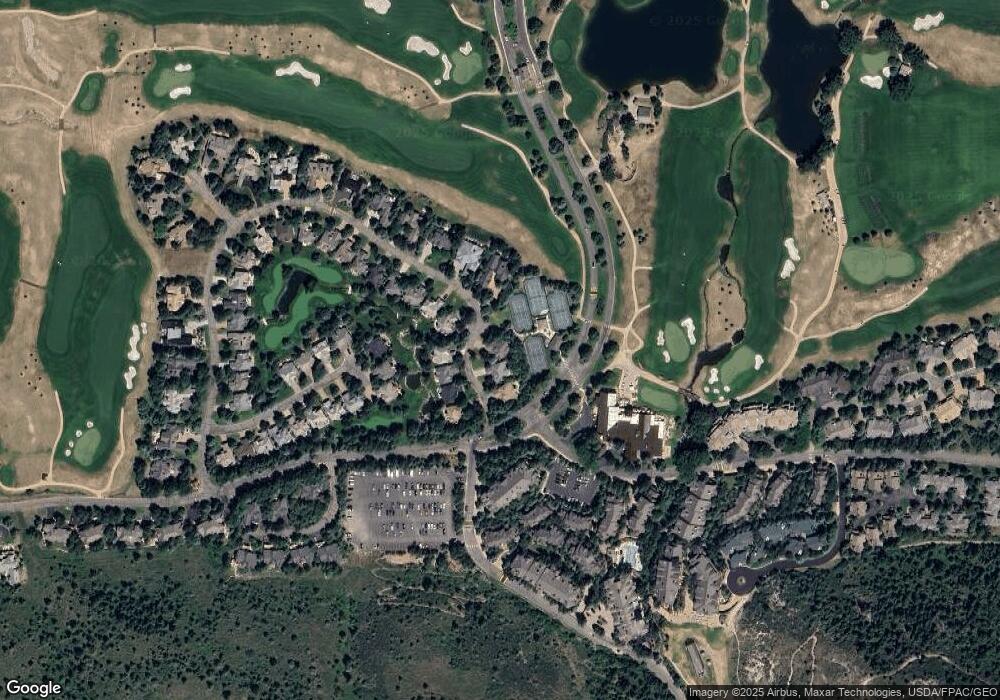
Map
Nearby Homes
- 673 Sawatch Dr Unit E8
- 74 Cresta Rd Unit 306
- 74 Cresta Rd Unit 101
- 627 Sawatch Dr Unit 108
- 142 Arrowhead Cir Unit B201
- 170 Wildflower Place Unit 8
- 80 Mountain Retreat Ct
- 73 Dakota Park
- 63 Dakota Park
- 35423 U S 6
- 20 Miller's Loop
- 0 Tbd Highway 6
- 38 Miller's Circle Rd
- 1121 Berry Creek Rd Unit B-3
- 34999 Hwy 6 Unit i 101
- 34999 Hwy 6 Unit K203
- 35021 U S 6
- 751 Singletree Rd Unit 28
- 12 Cabin Creek Ln
- 931 Singletree Rd Unit 4
- 357 Windemere Cir
- 373 Windermere Cir
- 336 Windermere Cir
- 306 Windermere Cir
- 342 Windemere Cir
- 346 Windermere Cir
- 348 Windermere Cir
- 311 Windermere Cir
- 290 Windemere Cir
- 278 Windermere Cir
- 11 Cresta Rd Unit 11
- 295 Windermere Cir
- 90 Ambleside Place
- 90 Ambleside Place
- 86 Ambleside Place
- 266 Windermere Cir
- 94 Ambleside Place
- 8 Cresta Rd Unit 8
- 86 Ambleside Place
- 275 Windermere Cir